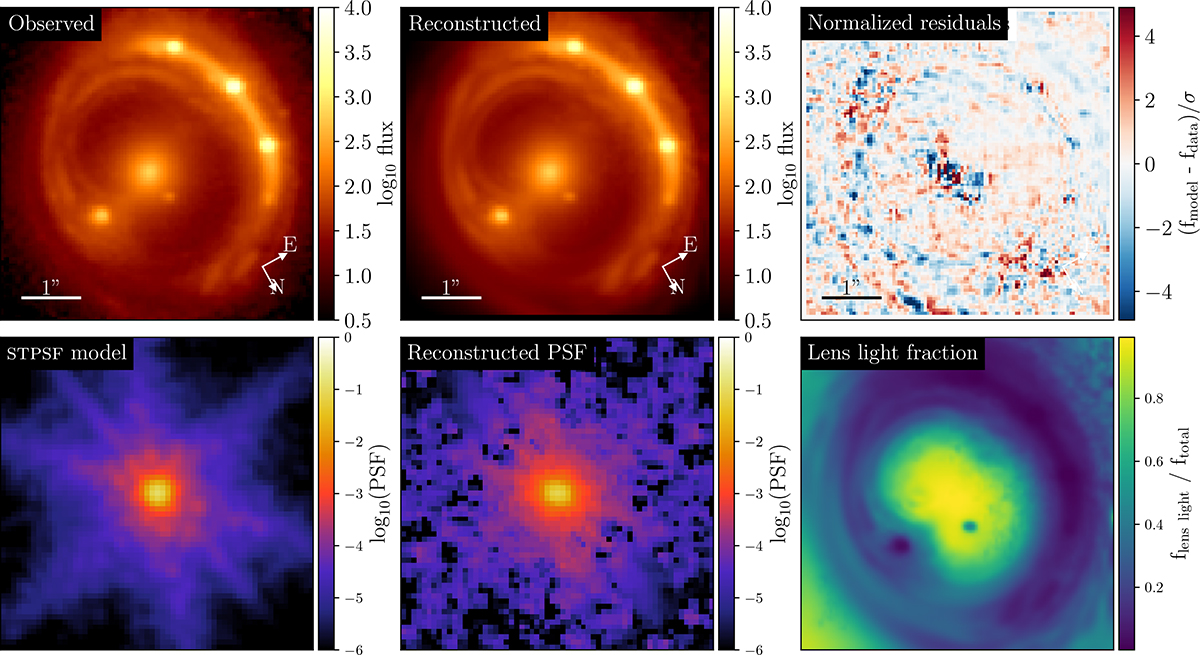
Fig. 2.
Download original image
Lens modeling with the image obtained by summing the datacube within 8700−8800 Å in the lens galaxy’s rest frame. This wavelength range covers the Ca triplets of the lens galaxy. Top row, from left to right: Illustration of the data, the optimized-model-based reconstruction of the data, and the normalized residuals. Bottom row, from left to right: Illustration of the initial PSF model from STPSF, the iteratively reconstructed PSF, and the fraction of the lens light compared to the total light in the image. The reconstructed PSF will be necessary for dynamical modeling, and we use the lens light fraction to obtain the S/N of the lens galaxy for Voronoi binning.
Current usage metrics show cumulative count of Article Views (full-text article views including HTML views, PDF and ePub downloads, according to the available data) and Abstracts Views on Vision4Press platform.
Data correspond to usage on the plateform after 2015. The current usage metrics is available 48-96 hours after online publication and is updated daily on week days.
Initial download of the metrics may take a while.