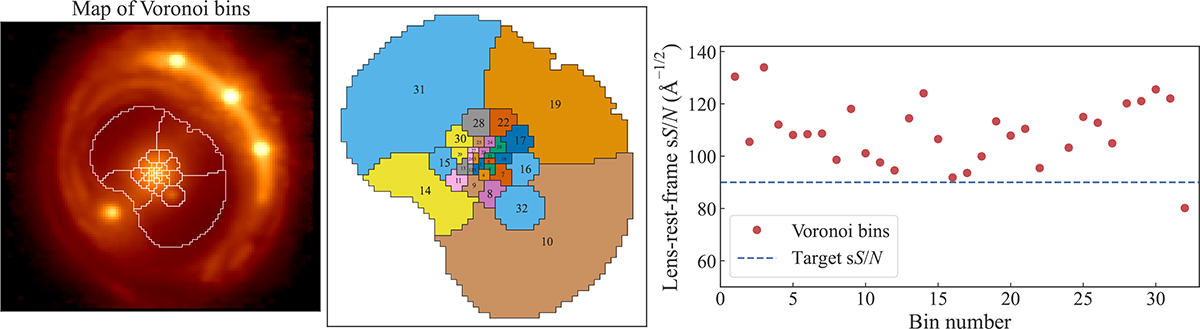
Fig. 3.
Download original image
Voronoi binning map. Left panel: Voronoi bins outlined over the white-light image of the system. Middle panel: Bin numbering. Right panel: Total sS/N for each Voronoi bin. The horizontal dashed line marks 90 Å−1/2, which we set as the minimum target for each bin. Only the last Voronoi bin, which contains the satellite galaxy, is slightly below this sS/N target.
Current usage metrics show cumulative count of Article Views (full-text article views including HTML views, PDF and ePub downloads, according to the available data) and Abstracts Views on Vision4Press platform.
Data correspond to usage on the plateform after 2015. The current usage metrics is available 48-96 hours after online publication and is updated daily on week days.
Initial download of the metrics may take a while.