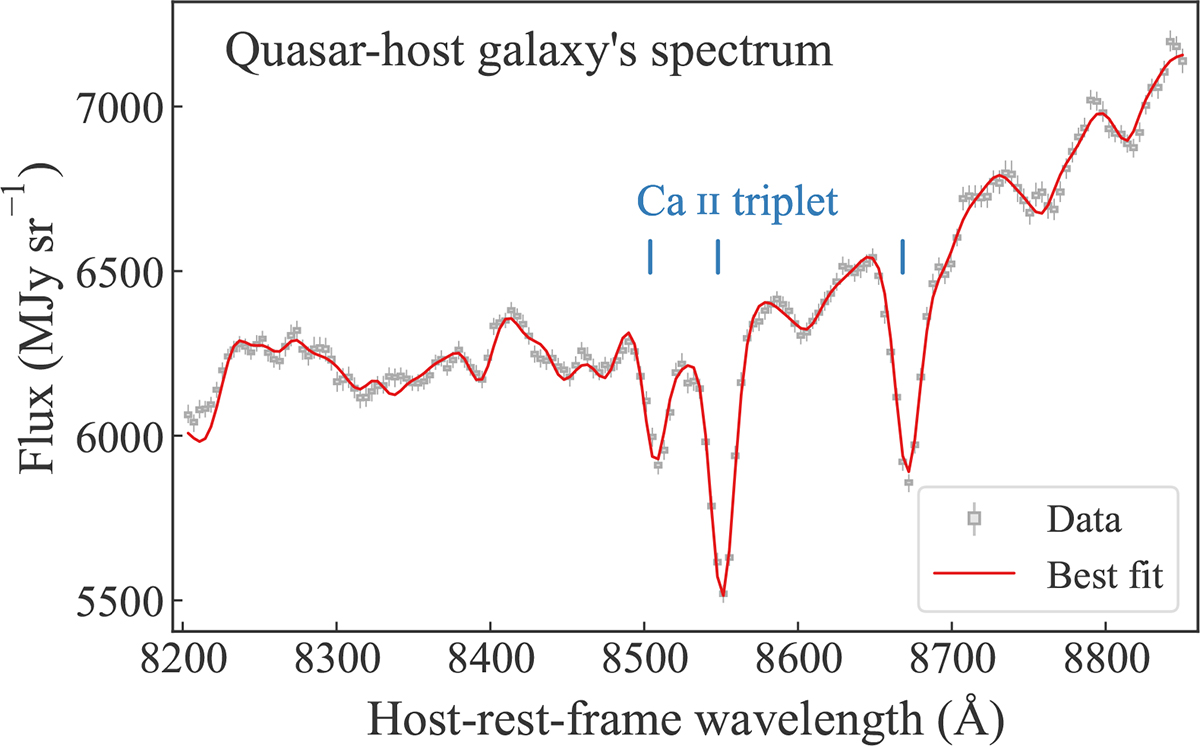
Fig. 4.
Download original image
Fitting of the Ca II region of the quasar host galaxy. The gray bars represent the data points, with the width of each bar corresponding to the pixel size and the height representing the original ±1σ noise level. The gray lines attached to the bars represent the boosted uncertainty levels to achieve χred2 = 1. The red line illustrates the best-fit model. The Ca II triplet features are marked with blue lines.
Current usage metrics show cumulative count of Article Views (full-text article views including HTML views, PDF and ePub downloads, according to the available data) and Abstracts Views on Vision4Press platform.
Data correspond to usage on the plateform after 2015. The current usage metrics is available 48-96 hours after online publication and is updated daily on week days.
Initial download of the metrics may take a while.