Fig. 5.
Download original image
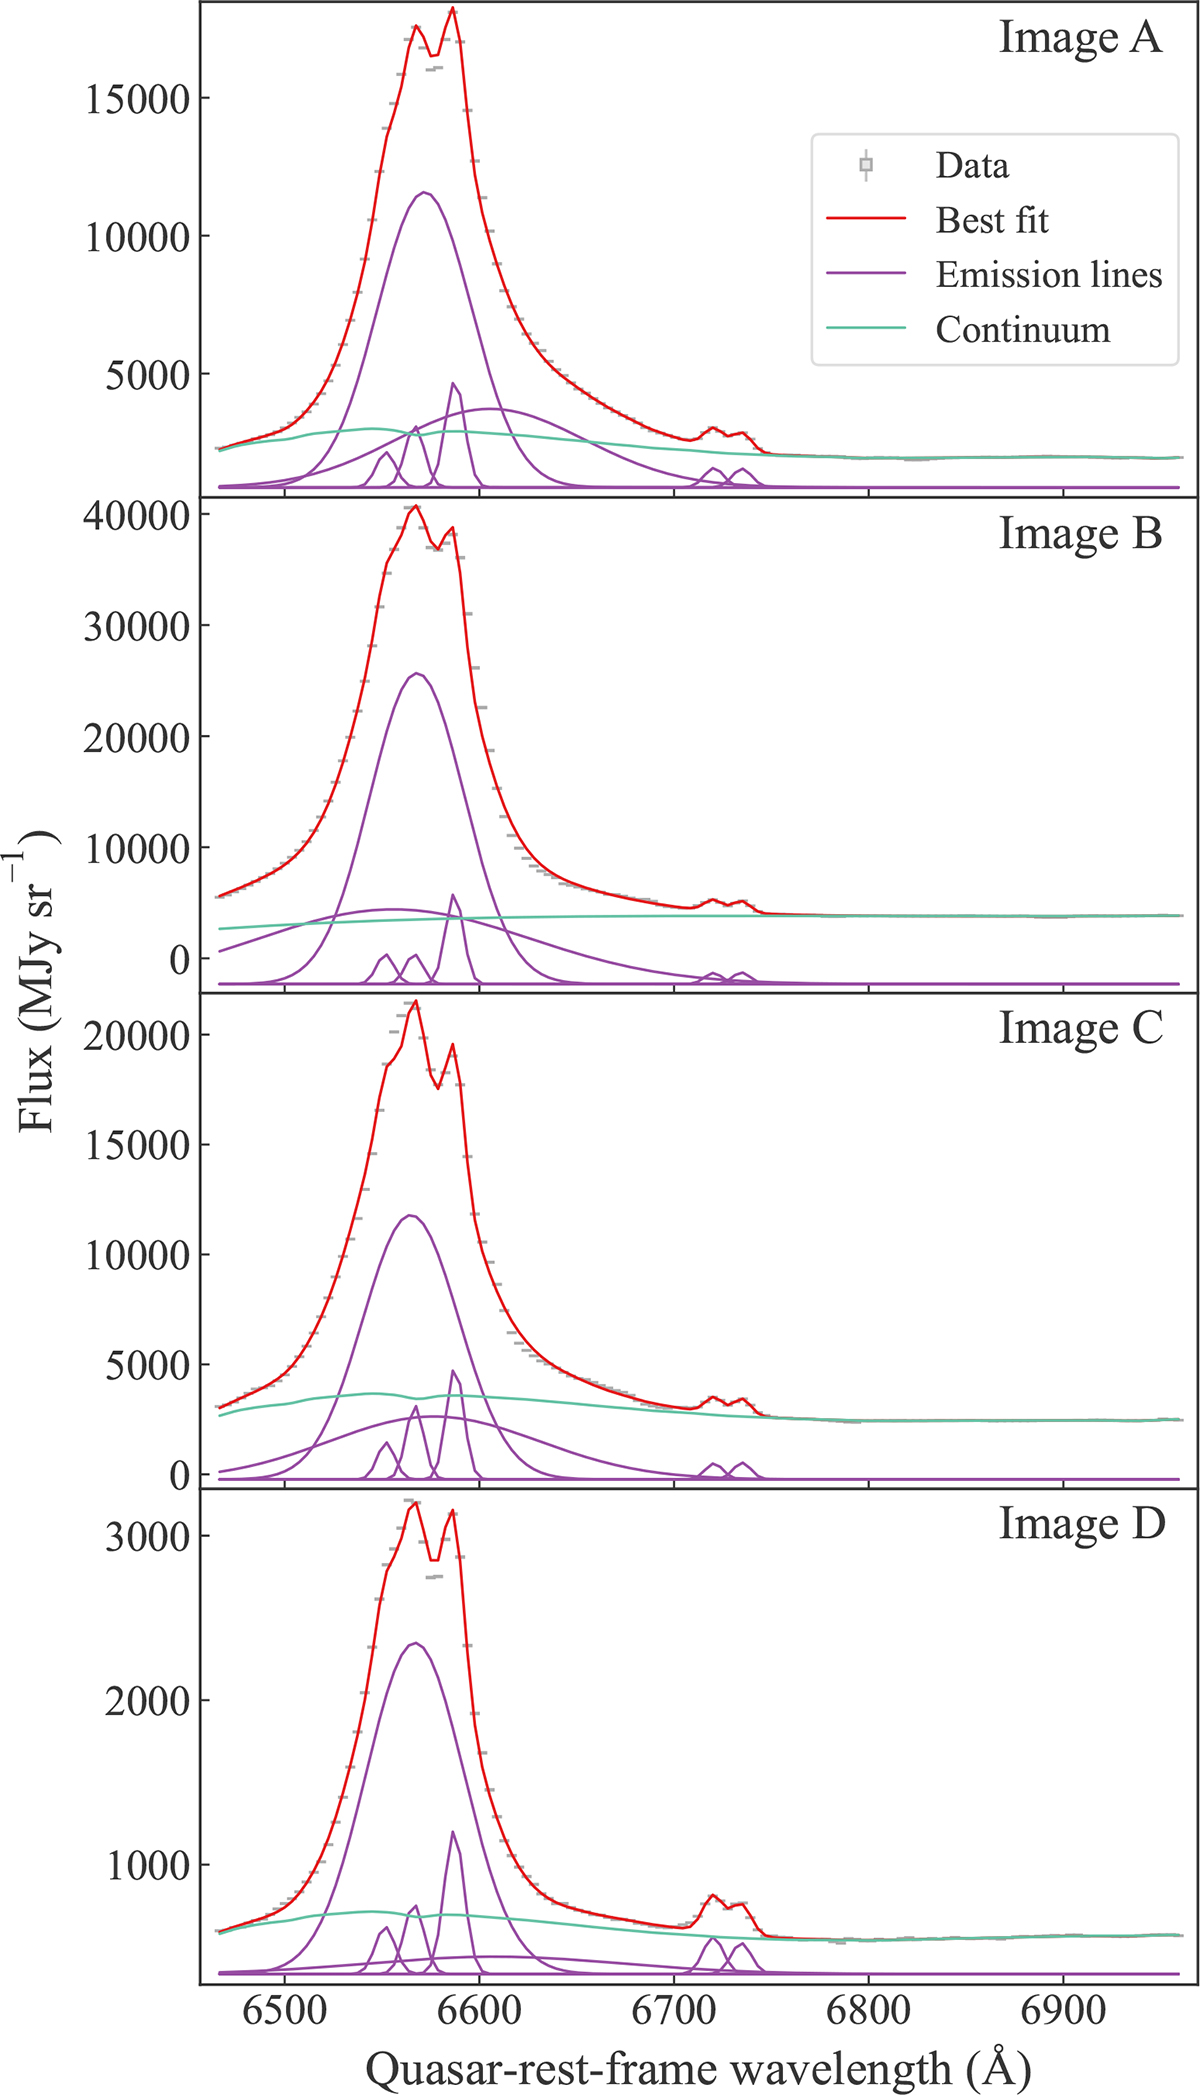
Fitting of the quasar lines at images A, B, C, and D, respectively, from top to bottom. The observed spectra are shown with gray bars, with the width corresponding to the bin width and the height representing the ±1σ noise range. The red lines show the best fit. The individual narrow and emission lines from the best fit are shown in purple, and the lens galaxy’s stellar continuum is shown in emerald. We adopted the best-fit gas lines with fixed relative amplitudes for all three images as free linear components in our kinematic fitting of the spectra across the entire field of view.
Current usage metrics show cumulative count of Article Views (full-text article views including HTML views, PDF and ePub downloads, according to the available data) and Abstracts Views on Vision4Press platform.
Data correspond to usage on the plateform after 2015. The current usage metrics is available 48-96 hours after online publication and is updated daily on week days.
Initial download of the metrics may take a while.