Fig. 6.
Download original image
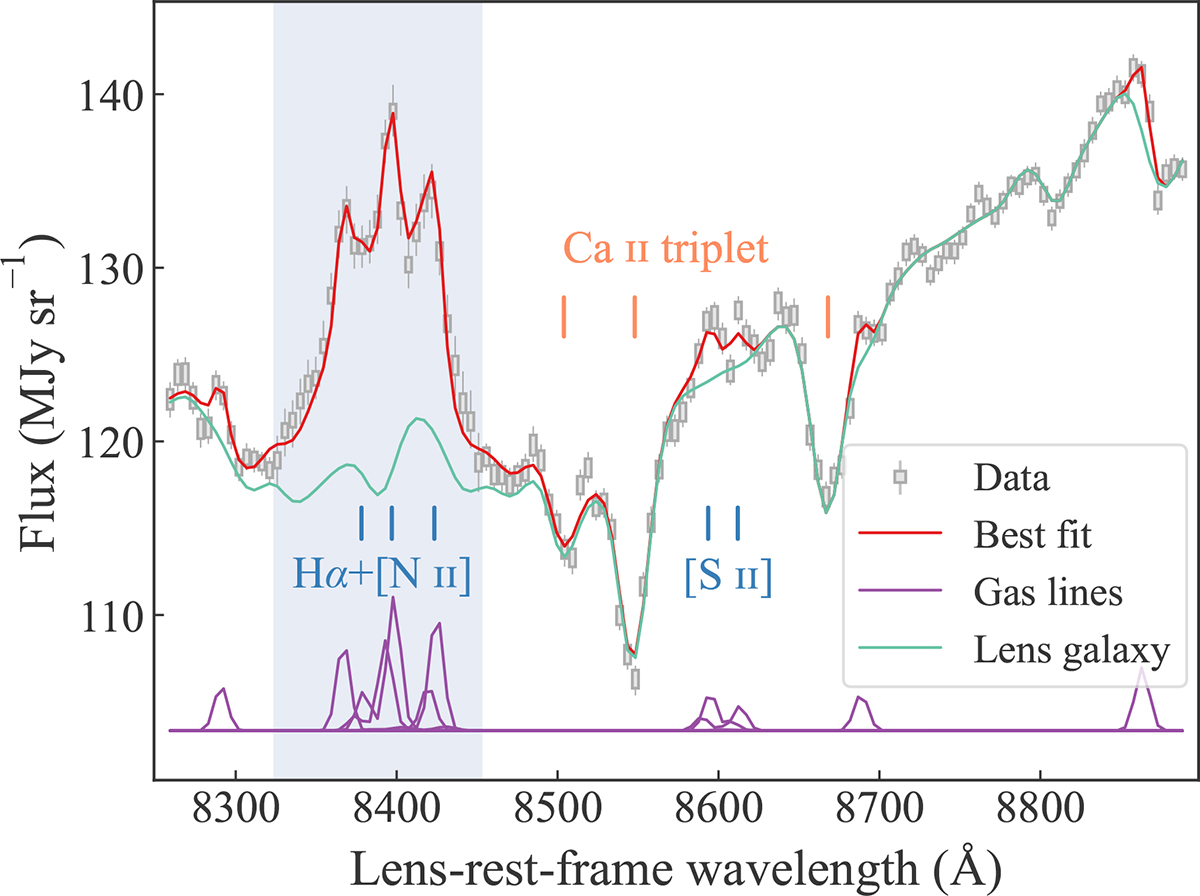
Best fit (red line) of the Voronoi-binned spectra in bin 22 as an example. The gray bars represent the observed data, with the width indicating the bin width and the height representing the original 1σ noise level. The vertical gray lines attached to the bars represent the boosted 1σ noise level. These 1σ noise levels for each pixel are estimated from random sampling given the covariance matrix. The Ca II triplet wavelengths from the lens galaxy are marked with orange lines, and the wavelengths of the host galaxy’s emission lines are marked with blue lines. The blue-shaded region marks where we boosted the noise levels around the Hα and [N II] lines. The emerald line shows the contribution from the lens galaxy’s stars. The sets of narrow emission lines from the quasar host galaxy (including spurious spikes identified close to 8300, 8700, and 8900 Å in this case) are shown in purple.
Current usage metrics show cumulative count of Article Views (full-text article views including HTML views, PDF and ePub downloads, according to the available data) and Abstracts Views on Vision4Press platform.
Data correspond to usage on the plateform after 2015. The current usage metrics is available 48-96 hours after online publication and is updated daily on week days.
Initial download of the metrics may take a while.