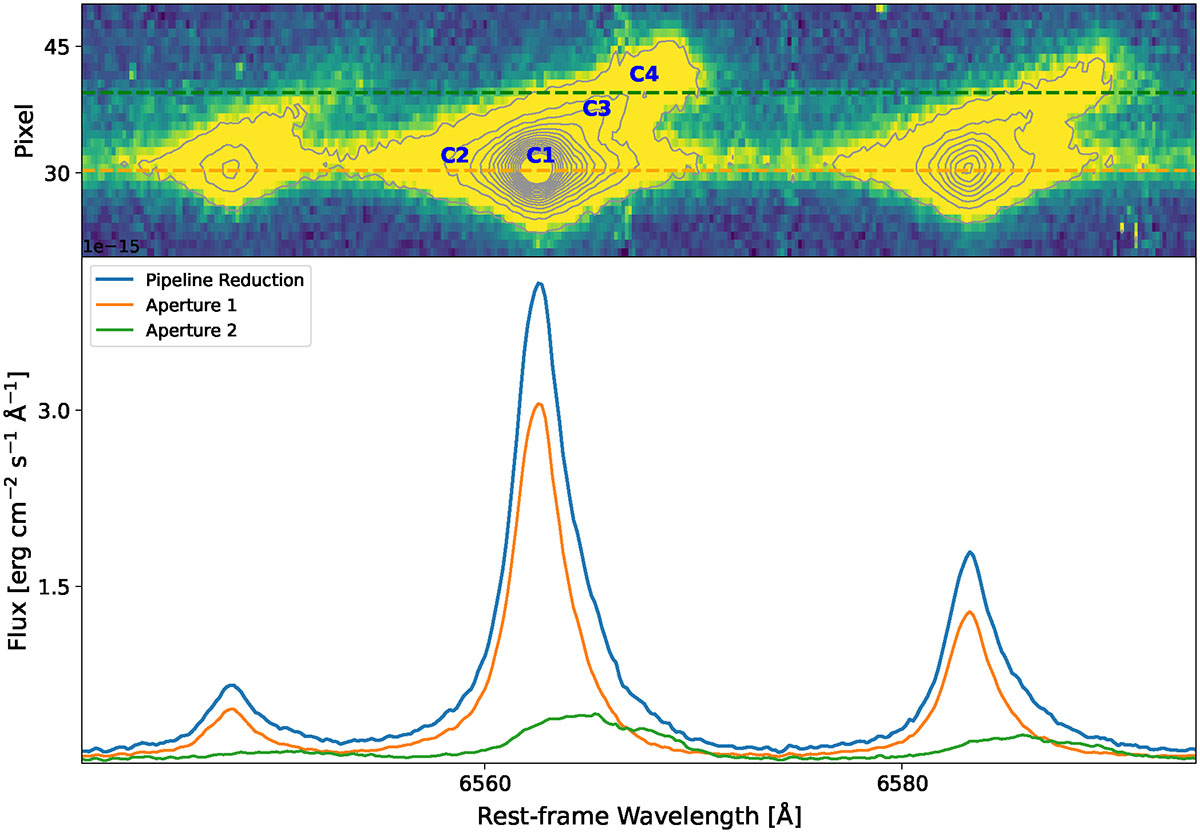
Fig. 1.
Download original image
Top: 2D spectrum of SDSS143417 around the Hα[N II] region, with gray contours tracing flux levels and blue crosses marking the positions used for Gaussian fitting. Bottom: 1D spectra extracted with different apertures: the ESO pipeline, 30 px/side, including both knots (blue), IRAF/apall, 5 px centered on the brightest knot (orange), and IRAF/apall, with asymmetric aperture sampling the secondary knot (green). Vertical dashed lines indicate the wavelength ranges where the 2D contours reveal asymmetries, serving as guides to identify additional kinematic components.
Current usage metrics show cumulative count of Article Views (full-text article views including HTML views, PDF and ePub downloads, according to the available data) and Abstracts Views on Vision4Press platform.
Data correspond to usage on the plateform after 2015. The current usage metrics is available 48-96 hours after online publication and is updated daily on week days.
Initial download of the metrics may take a while.