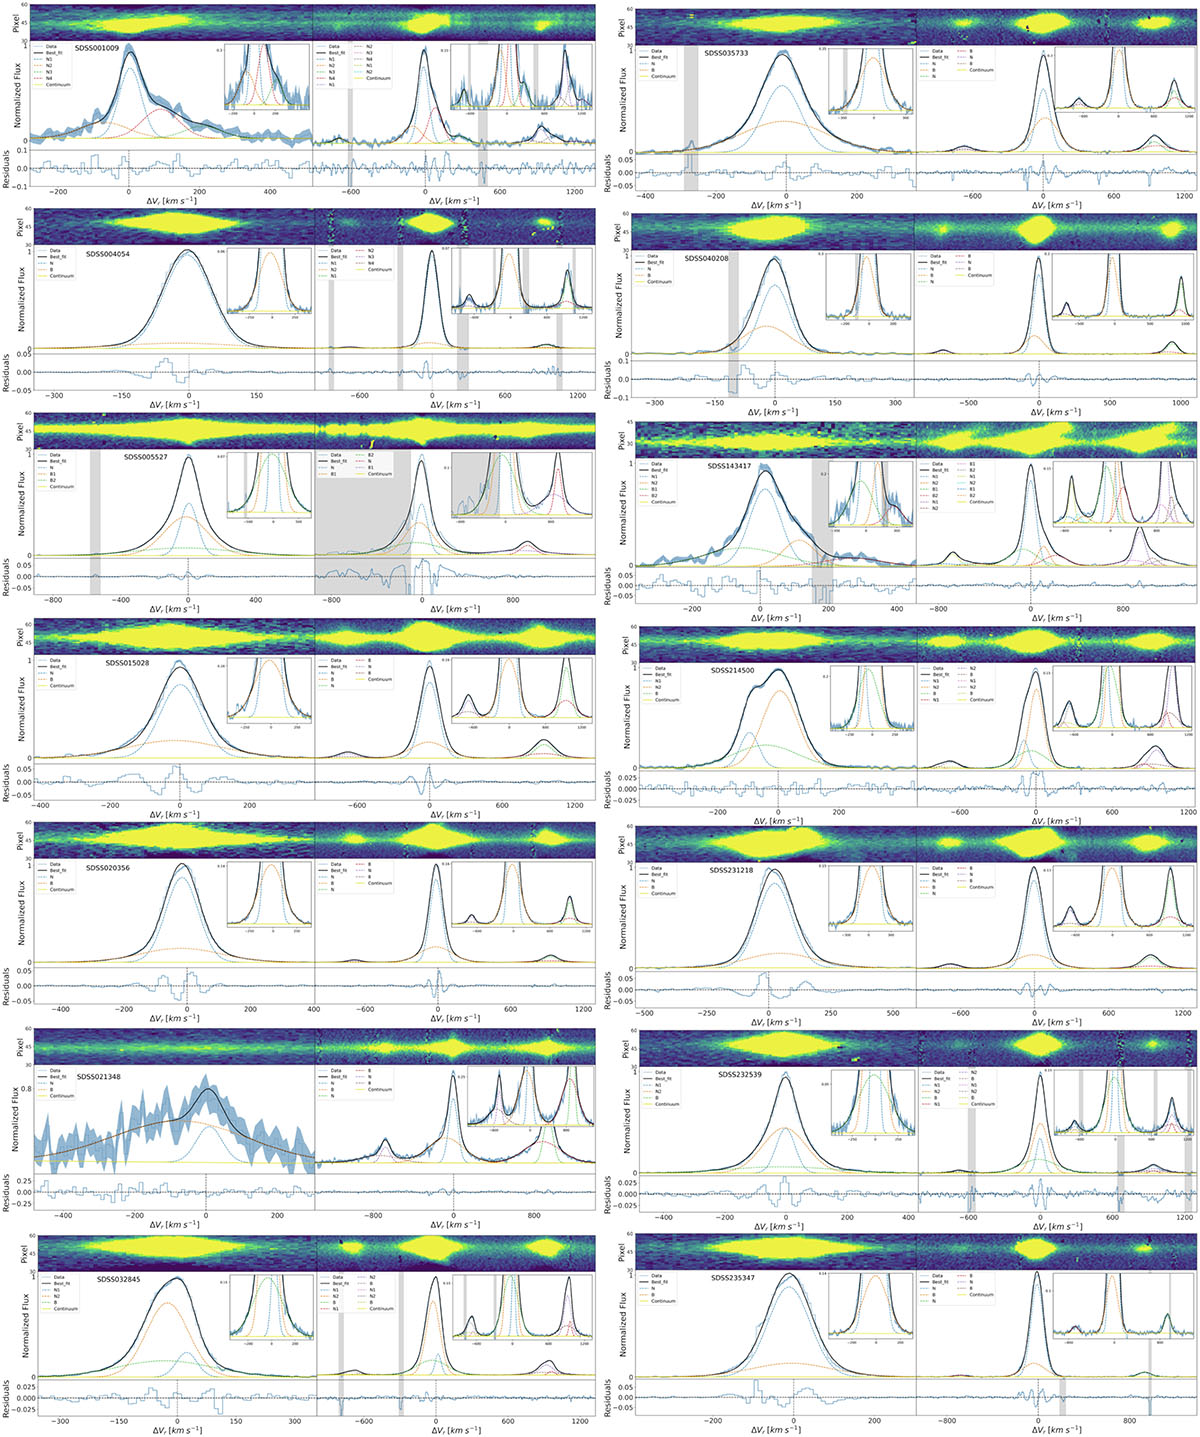
Fig. 2.
Download original image
Multi-Gaussian fitting of bright emission lines for the galaxies in our sample. Top: 2D spectra, with the y-axis in pixel units. Center: Gaussian fits of [O III]λ5007Å(left) and Hα (right). Bottom: Fit residuals. The flux axis is normalized to the peak emission of each line. Spectra are shown in light blue (labeled “Data”). The blue shadow represents the variance spectrum. The black line models the fit. The dashed lines show the different fitted components. Gray shadows are flagged regions excluded from fits. The yellow line represents the continuum. Insets that zoom in onto the faint line wings are included in the upper-right corner of each plot.
Current usage metrics show cumulative count of Article Views (full-text article views including HTML views, PDF and ePub downloads, according to the available data) and Abstracts Views on Vision4Press platform.
Data correspond to usage on the plateform after 2015. The current usage metrics is available 48-96 hours after online publication and is updated daily on week days.
Initial download of the metrics may take a while.