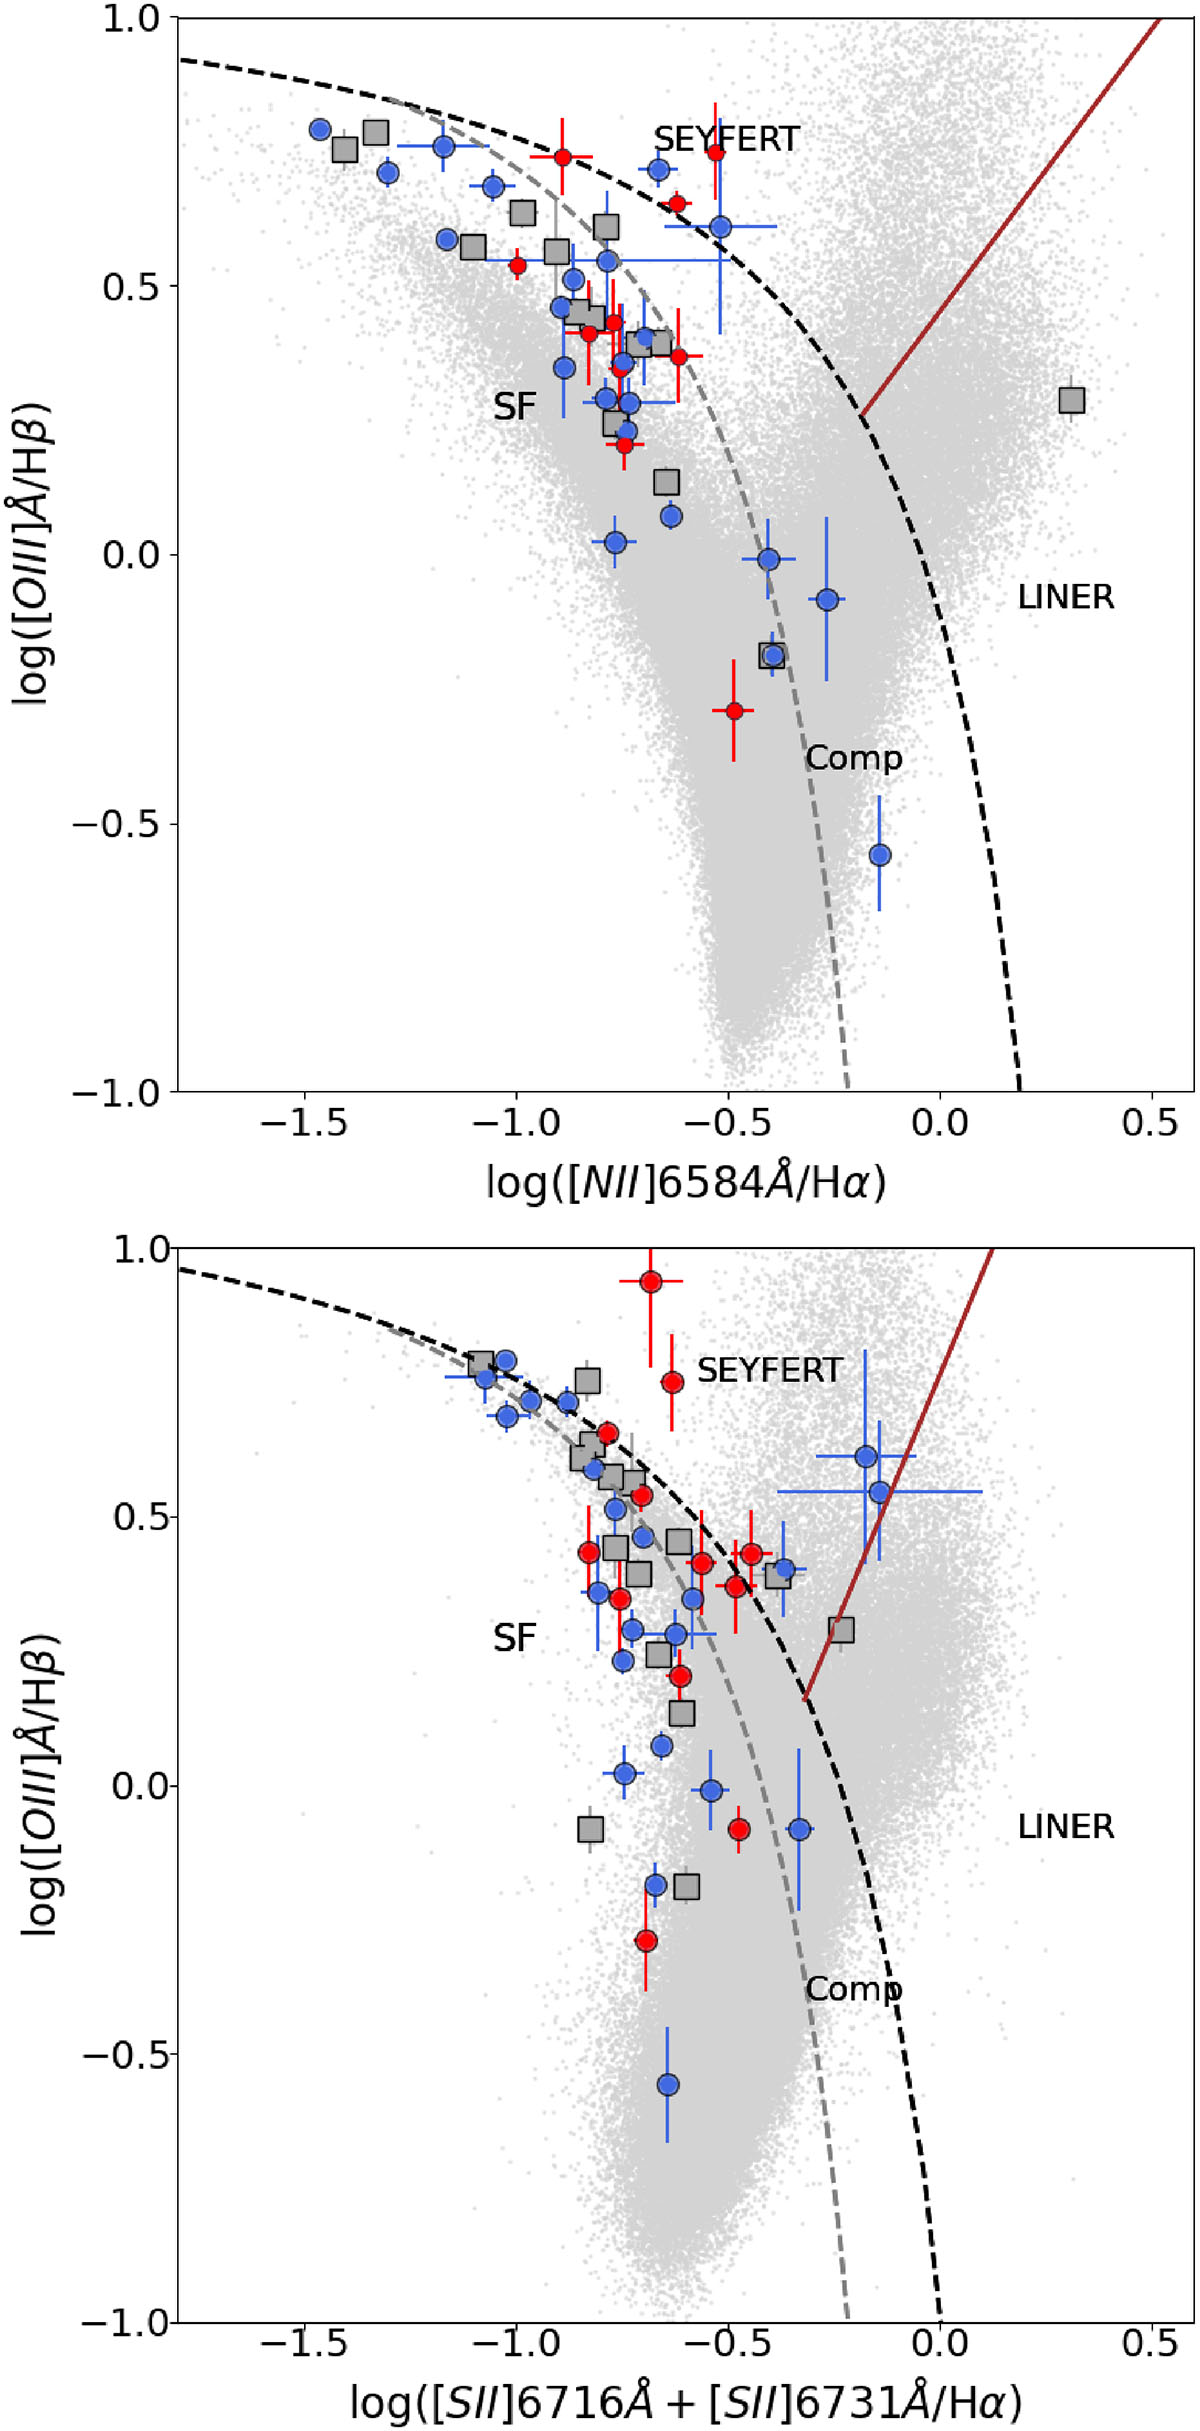
Fig. 4.
Download original image
Classic diagnostic diagrams based on emission line ratios (Baldwin et al. 1981; Veilleux & Osterbrock 1987): [O III]λ5007/Hβ vs. [NII]λ6584/Hα (top) and [O III]λ5007/ Hβ vs. [S II]λλ6716.6731/Hα (bottom). Symbols show the emission-line–integrated fluxes (gray squares) and narrow (blue circles) and broad (red circles) Gaussian components for each galaxy. The gray dots correspond to the SDSS-DR7 MPA-JHU galaxy sample from Pérez-Montero et al. (2021). Regions of different excitation mechanisms are labeled and established by the theoretical and empirical demarcation lines of Kewley et al.; Kewley et al. (2001; 2006, dashed black), Kauffmann et al. (2003, dashed gray), and Schawinski et al. (2007), solid brown).
Current usage metrics show cumulative count of Article Views (full-text article views including HTML views, PDF and ePub downloads, according to the available data) and Abstracts Views on Vision4Press platform.
Data correspond to usage on the plateform after 2015. The current usage metrics is available 48-96 hours after online publication and is updated daily on week days.
Initial download of the metrics may take a while.