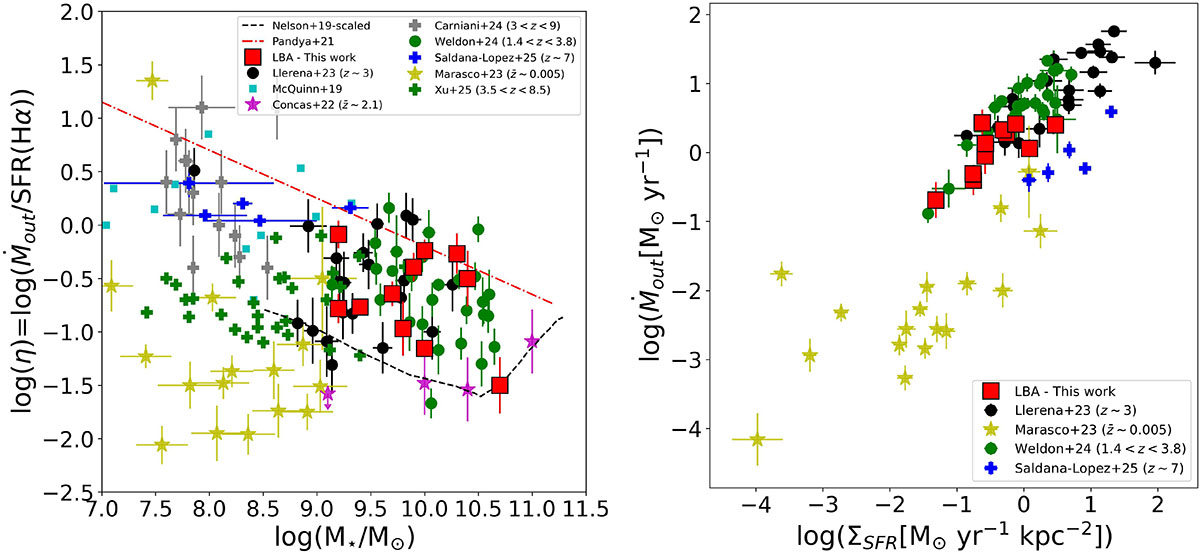
Fig. 5.
Download original image
Outflow mass loading factor as a function of the stellar mass of galaxies (left) and stellar mass outflow rate as a function of SFR surface density (right). Our LBAs are shown as red squares. Green and black circles are LBGs at z ∼ 1.4 − 3.8 from Weldon et al. (2024) and Llerena et al. (2023), respectively, while purple stars are mean-weighted averages from stacks of star-forming galaxies at z ∼ 2.1 from Concas et al. (2022). Gray and blue crosses are low-mass star-forming galaxies at z ∼ 3 − 9 observed with JWST/NIRSpec R = 2700 spectroscopy from Carniani et al. (2024) and Saldana-Lopez et al. (2025), respectively. The green crosses are the results from Xu et al. (2025b) for galaxies at z ∼ 3 − 9. Yellow stars are local dwarf galaxies from Marasco et al. (2023). Light blue squares indicate local dwarf galaxies from McQuinn et al. (2019). Dashed red lines are rescaled relations from Ilustris-TNG simulations of Nelson et al. (2019), and dashed black lines are from FIRE-2 simulations of Pandya et al. (2021).
Current usage metrics show cumulative count of Article Views (full-text article views including HTML views, PDF and ePub downloads, according to the available data) and Abstracts Views on Vision4Press platform.
Data correspond to usage on the plateform after 2015. The current usage metrics is available 48-96 hours after online publication and is updated daily on week days.
Initial download of the metrics may take a while.