Open Access
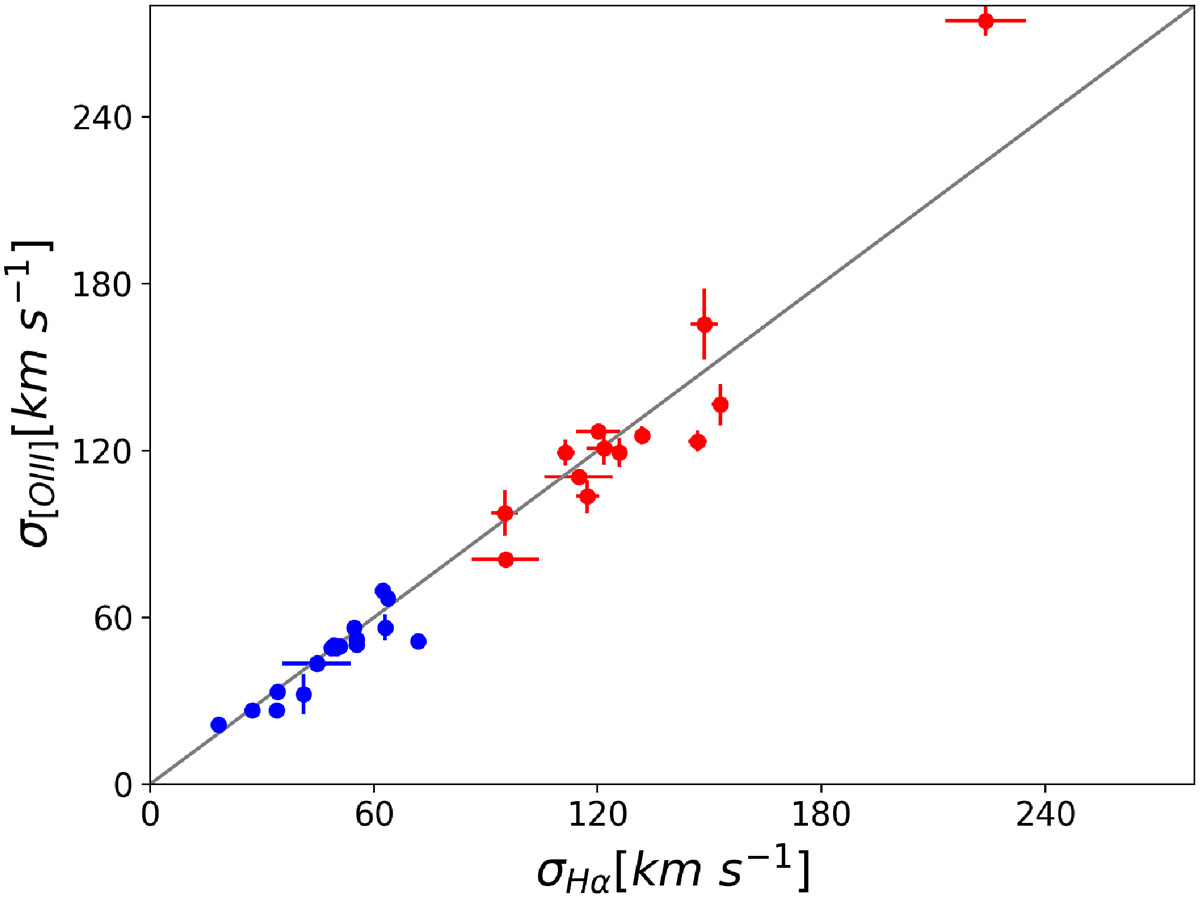
Fig. B.1.
Download original image
Comparison of Hα and [O III] velocity dispersion for our multicomponent fitting. Blue and red symbols represent narrow an broad Gaussian components. The solid gray line represents the unitary relationship.
Current usage metrics show cumulative count of Article Views (full-text article views including HTML views, PDF and ePub downloads, according to the available data) and Abstracts Views on Vision4Press platform.
Data correspond to usage on the plateform after 2015. The current usage metrics is available 48-96 hours after online publication and is updated daily on week days.
Initial download of the metrics may take a while.