Open Access
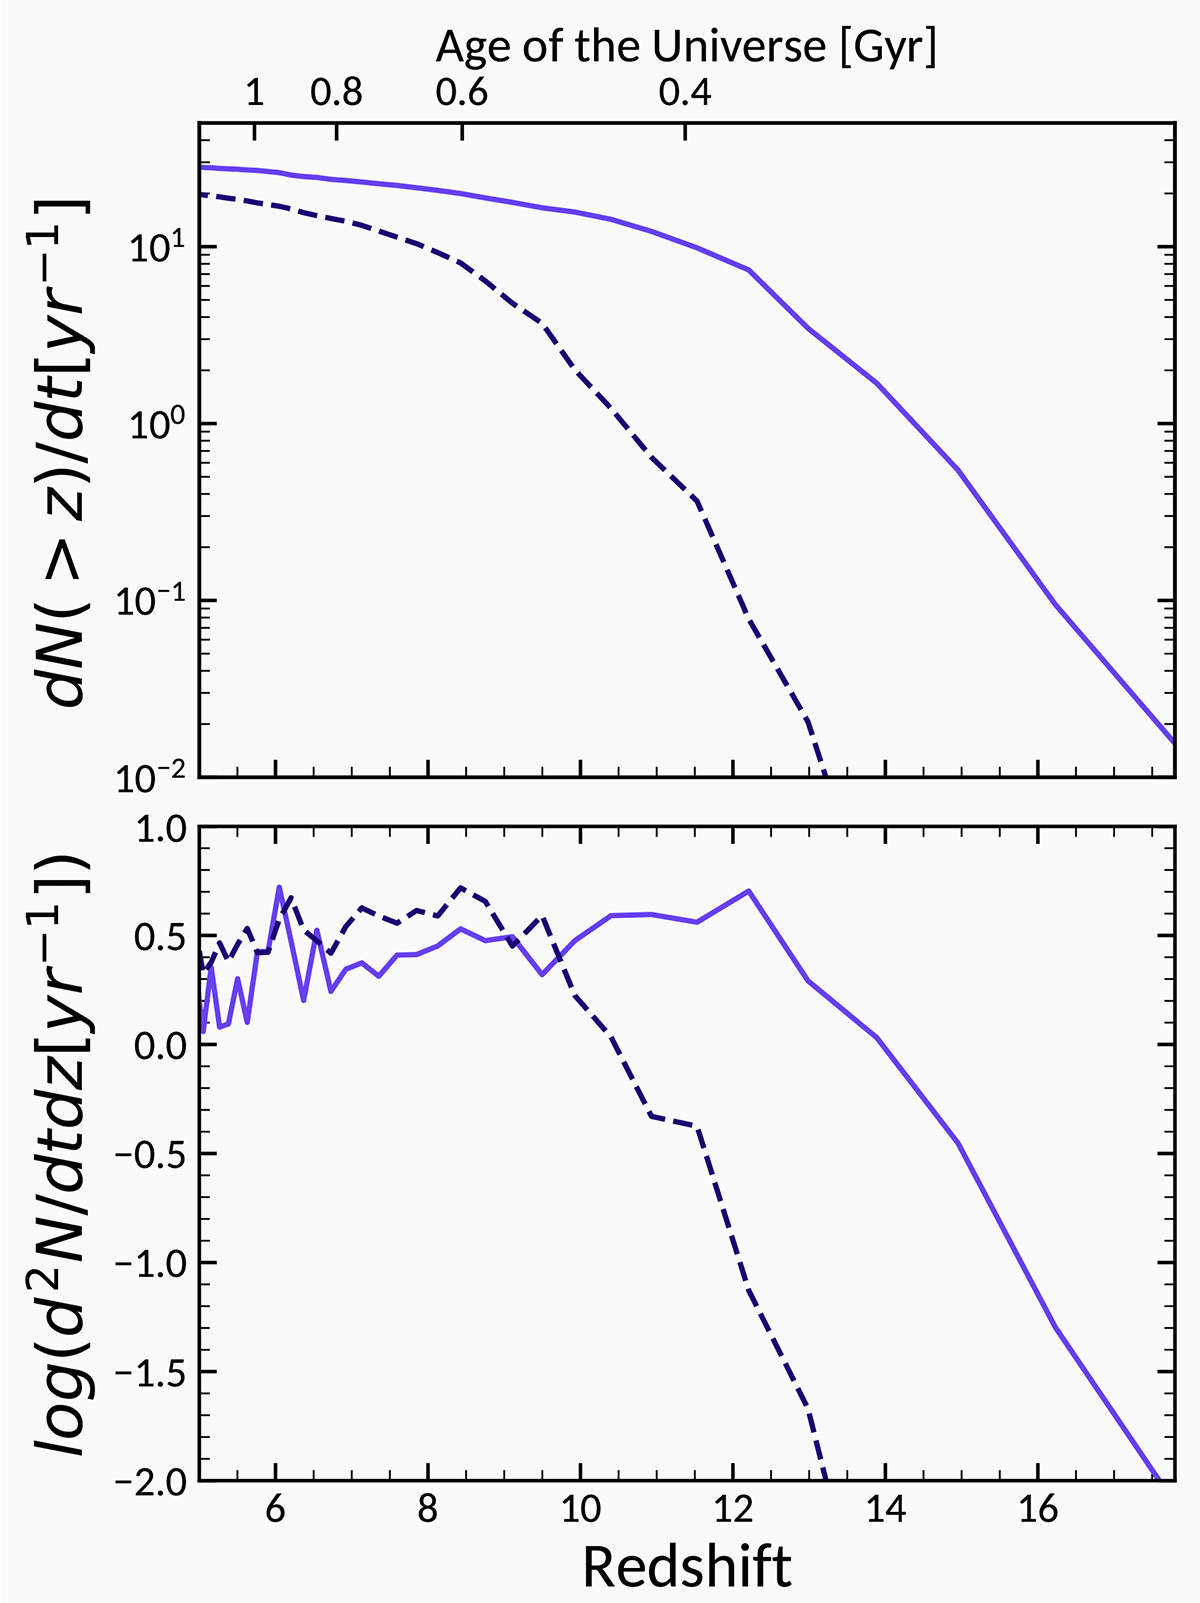
Fig. 4.
Download original image
Raw merger rates as a function of redshift. In the upper panel, we show the cumulative merger events for BHs per year as a function of redshift, and in the bottom are the merger rates at a given redshift bin. Instantaneous models are shown as solid lines, while delayed models are indicated with dashed lines.
Current usage metrics show cumulative count of Article Views (full-text article views including HTML views, PDF and ePub downloads, according to the available data) and Abstracts Views on Vision4Press platform.
Data correspond to usage on the plateform after 2015. The current usage metrics is available 48-96 hours after online publication and is updated daily on week days.
Initial download of the metrics may take a while.