| Issue |
A&A
Volume 707, March 2026
|
|
|---|---|---|
| Article Number | A360 | |
| Number of page(s) | 18 | |
| Section | Extragalactic astronomy | |
| DOI | https://doi.org/10.1051/0004-6361/202556153 | |
| Published online | 19 March 2026 | |
Black hole merger rates in the first billion years in light of JWST data
1
Kapteyn Astronomical Institute, University of Groningen, 9700 AV Groningen
The Netherlands
2
Departamento de Astronomía Cerro Calan, Universidad de Chile, Camino al observatorio 1515 Las Condes Santiago de Chile, Chile
3
Millennium Nucleus on Transversal Research and Technology to Explore Supermassive Black holes (TITANS), Chile
4
Canadian Institute for Theoretical Astrophysics, 60 St George St, University of Toronto, Toronto ON M5S 3H8, Canada
5
David A. Dunlap Department of Astronomy and Astrophysics, University of Toronto, 50 St George St, Toronto ON M5S 3H4, Canada
6
Department of Physics, 60 St George St, University of Toronto, Toronto ON M5S 3H8, Canada
7
Departemen Fisika, FMIPA, Universitas Indonesia, Depok 16424, Indonesia
8
LUX, Observatoire de Paris, Université PSL, Sorbonne Université, CNRS, 75014, Paris, France
⋆ Corresponding author: This email address is being protected from spambots. You need JavaScript enabled to view it.
Received:
27
June
2025
Accepted:
17
November
2025
Abstract
Context. Recent James Webb Space Telescope (JWST) discoveries have unveiled an abundance of faint and massive active galactic nuclei (AGNs) at high redshifts (z = 4–9) that surpass the extrapolated bolometric and ultraviolet luminosity functions from previous AGN campaigns by ten to one hundred times. The two main models that have been put forward to explain these observations correspond to light seeds (≈150 M⊙) accreting in episodes of super Eddington, and heavy seeds (≈103 − 105 M⊙) growing at the Eddington limit. Future gravitational observatories such as the Laser Interferometer Satellite Antenna (LISA) will help disentangle these models by reporting the black hole merger events from mid to high redshifts.
Aims. With this work, we aim to report the predicted merger rates in the heavy seed scenario in light of recent JWST data. In our models we explore (i) instantaneous merging between BHs, and (ii) delayed merging after a dynamical timescale, as well as extreme spin configurations (a = 0.99, a = −0.99) to bracket BH mass growth.
Methods. We used Delphi, a semi-analytical model that tracks baryonic physics over a hierarchical evolution of dark matter halos through cosmic time within the first billion years of the Universe. We calibrated this model for it to simultaneously reproduce galaxy and JWST-AGN observables.
Results. We show reasonable agreement with the bolometric luminosity function at z = 6, where BHs must accrete ten to one hundred times more gas than in previous works calibrated to pre-JWST data. However, we underpredict (overpredict) the bright end 1045.5 erg s−1 (all luminosity range) at z = 7 (z = 5) by 1–3.2 dex (0.22–1.6 dex). Regarding BH-BH merger events, the instantaneous (delayed) models predict a total of 28.06 (19.61) yr−1 for BHs at z ≥ 5, which is within the range of merger rates reported in previous literature.
Key words: galaxies: active / galaxies: high-redshift / galaxies: nuclei / quasars: supermassive black holes
© The Authors 2026
 Open Access article, published by EDP Sciences, under the terms of the Creative Commons Attribution License (https://creativecommons.org/licenses/by/4.0), which permits unrestricted use, distribution, and reproduction in any medium, provided the original work is properly cited.
This article is published in open access under the Subscribe to Open model. This email address is being protected from spambots. You need JavaScript enabled to view it. to support open access publication.
1. Introduction
The past few years have seen an enormous increase in the number of active supermassive black holes (SMBHs; > 106 M⊙) detected in the early Universe at redshifts z ≳ 4. Samples of active galactic nuclei (AGNs) collected using ground-based facilities (Fan et al. 2006; Bañados et al. 2016; McGreer et al. 2013; Giallongo et al. 2015; Niida et al. 2020) are now being supplemented by both photometrically (Kokorev et al. 2024; Akins et al. 2025a) and spectroscopically confirmed objects (Harikane et al. 2023b; Ding et al. 2023; Yue et al. 2024; Maiolino et al. 2024; Greene et al. 2023; Matthee et al. 2023; Lin et al. 2024) being detected with the James Webb Space Telescope (JWST) out to z ∼ 10.4. The AGNs selected with JWST instruments appear surprisingly abundant, reporting number densities that surpass the extrapolated faint end of the predicted bolometric and ultraviolet luminosity Functions (UVLFs) pre-JWST by one to two orders of magnitude (Shen et al. 2020; Niida et al. 2020). The black hole (BH) masses of JWST-AGNs, estimated to range between 106 − 109 M⊙ using single-epoch measurements, appear overmassive against the stellar masses of their galaxy hosts, deviating from predictions of local relations (Reines & Volonteri 2015). Debate persists on whether scaling relations between BHs and their galaxy properties evolve with redshift (Pacucci et al. 2023) or arise from a selection bias effect that JWST instruments yield (Li et al. 2025). Nonetheless, single-epoch techniques for BH mass tracers have been shown to be robust in low redshift (z < 0.1) AGNs (Bentz et al. 2013), which also assume virial equilibrium in their broad line region, a condition that is not clearly satisfied for sources accreting close or above the Eddington limit (Lupi et al. 2024; King 2024). Additionally, a subsample of JWST-AGNs, categorized as little red dots (LRDs) for their red colors and compact morphology, showcase atypical spectral energy distribution (SEDs), with an uncertain origin in their UV continuum (Akins et al. 2025a) and a lack of X-ray emission (Ananna et al. 2024; Maiolino et al. 2025).
Nevertheless, diverse theoretical models have been proposed to explain the origin and fast assembly of SMBHs. Among them are the formation of “heavy” BH seeds (103 − 105 M⊙) accreting at the Eddington limit (Kokorev et al. 2023; Bogdan et al. 2023; Natarajan et al. 2024; Dayal et al. 2025) or through episodes of super Eddington rates, and the formation of light BH seeds (≤102 M⊙) accreting at super Eddington rates (Lupi et al. 2016, 2024; Regan et al. 2019).
The study and detection of gravitational waves from BH-BH mergers opens a new way to understanding the assembly of SMBHs through merger events. The collaboration from ground-based gravitational observatories LIGO-VIRGO-KAGRA have so far detected approximately 90 merging signals from stellar mass BHs (≤102 M⊙) in the local Universe Abbott et al. (2020, 2021, 2023, 2024), and others). Recent results from the second data release of the Pulsar Timing Array (EPTA Collaboration and InPTA Collaboration 2024), which probes the nano-Hertz frequency of gravitational waves using pulsars, report a large amplitude signal suggestive of a cosmic GW background from SMBH binaries above 107 M⊙ (SMBHBs) at low redshifts z < 1. Future gravitational wave observatories will be aimed at detecting BH mergers in the intermediate mass regimes 103 − 107 M⊙ at higher redshifts z ≥ 2. Among these are the Laser Interferometer Satellite Antenna (LISA) (Amaro-Seoane et al. 2023), which would detect mergers from 103 − 107 M⊙ BHs in their last stages of inspiraling and subsequent merger up to z ∼ 20, and the Einstein Telescope (ET), which is sensitive to ≤103 M⊙ BH binary systems at z ≥ 2 (Punturo et al. 2010). Detecting signals of massive BH mergers through cosmic time will provide valuable insight into the growth history of BHs via mergers, and an even stronger constraining power on the theoretical models of BH formation and growth (Valiante et al. 2018; Amaro-Seoane et al. 2023) than what can currently be speculated based on their electromagnetic emission.
So far, many theoretical predictions of BH merger rates have been drawn using analytical, semi-analytical and cosmological hydrodynamical simulations. For the heavy seed scenario specifically, they range between 0.02 to 244 yr−1 for z > 5 (Dayal et al. 2019; Sesana et al. 2007, 2011; Ricarte & Natarajan 2018; Barausse et al. 2020; Klein et al. 2016; Katz et al. 2020; Bonetti et al. 2019). In contrast, predictions for light seeds are usually larger, given their more abundant number densities as remnants of large pop III stars, with merger rates that range between 26.11 to 140.45 yr−1 for z > 5 (Dayal et al. 2019; Ricarte & Natarajan 2018; Barausse et al. 2020; Klein et al. 2016; Sesana et al. 2007, 2011). However, most of these predictions are based on models calibrated on pre-JWST data. Therefore, we find it relevant to revisit these predictions using a semi-analytical model calibrated against JWST observations for AGNs and galaxies. We use the semi-analytical model code DELPHI, which tracks the hierarchical assembly of dark matter halos and their baryonic components (including stars and BHs) between z ∼ 26 − 4.5. The advantage of semi-analytical models lies in their computationally cheap calculations and their capability to track galaxy and BH growth, thus exploring a wide parameter space. In contrast, hydrodynamical cosmological simulations are restricted to seeding massive BHs of ≈104 − 6 M⊙ (Salcido et al. 2016; Tremmel et al. 2018; Katz et al. 2020; Volonteri et al. 2020) and are limited to the resolution of their dark matter particles (≈105 M⊙).
We adopted a ΛCDM model and considered the Planck 2018 results for the cosmological constants (Planck Collaboration VI 2020) (ΩΛ, Ωm, Ωb, h, σ8) = (0.6889, 0.3097, 0.04897, 0.677, 0.811), where ΩΛ is the dark energy density parameter, Ωm is the total matter density (including dark and baryonic matter), Ωb is the baryonic matter density, h is the dimensionless reduced Hubble constant (H0 = 100 h km s−1 Mpc−1), and σ8 is the matter fluctuation amplitude. We used a Kroupa initial mass function (Kroupa 2001) between 0.1 − 100 M⊙ with a slope of −1.3 (−2.3) between 0.1–0.5 (0.5–100) M⊙, and a mass-weighted solar metallicity value of Z⊙ = 0.0122 (Asplund et al. 2005). We express all magnitudes in this work in the standard AB system (Oke & Gunn 1983).
This work is structured as follows: In Section 2 we explain the theoretical framework and the models explored. In Section 3, we show how our models compare to AGN observables. In Section 4 we describe the emergence of the stellar to BH mass relation and the merger rates implied for each model. Finally, in Section 5 we discuss our results and conclusions.
2. The theoretical model
For this work we use DELPHI (Dark matter and the Emergence of gaLaxies in the ePocH of reIonization), a semi-analytical model that tracks galaxy and BH formation between z ∼ 40 − 4.5. First introduced in Dayal et al. (2014), since then has undergone many modifications to explore predictions for gravitational waves from BH mergers (Dayal et al. 2019) in the first billion years of cosmic time, the physical properties and growth of BHs in high-z galaxies (Piana et al. 2020, 2021), metal and dust evolution in high-z galaxies (Dayal et al. 2022; Mauerhofer & Dayal 2023; Mauerhofer et al. 2025), as well as the impact on reionization from BHs in light of JWST data (Dayal et al. 2025). From this point onward we will refer to Dayal (2019) as D19.
We build our theoretical framework for gas, stellar, BHs, dust and metal evolution as in Dayal et al. (2014, 2022, 2025), but including the recent modifications proposed in Mauerhofer et al. (2025), which adopts cold gas fractions and star formation efficiencies drawn from the SPHINX20 simulation (Rosdahl et al. 2022).
2.1. Dark matter merger trees and gas assembly
The dark matter halo merger tree was constructed following the Parkinson et al. (2007) algorithm, which describes a hierarchical assembly of halos based on the Extended Press-Schechter theory. The merger tree used in this work has halos with masses ranging between log(Mh/M⊙)=8 − 14 starting at z = 4.5, with 100 halos per dex distributed uniformly in log-space, i.e., 600 trees in total. This merger tree evolves backward up to redshift 26, in fixed timesteps of Δt = 30 Myr. At each timestep, a halo of mass M1 can either fragment into 2 halos of mass M2, where Mres < M2 < M1/2, or lose a fraction of its mass below the resolution limit (Mres). The lost fraction of dark matter accounts for the contribution of unresolved halos, i.e. smooth-accretion of dark matter ( ) from the intergalactic medium. The mass resolution of this merger tree is 108 M⊙. Each halo at z = 4.5 is assigned a comoving number density dN/dlogMh[cMpc−3 dex−1] by comparing to the Sheth-Tormen halo mass function (HMF) (Sheth & Tormen 1999) at that redshift. This number density is inherited by all the descendants of the corresponding halo.
In the starting leaves of our merger tree (first-generation halos resolved in the semi-analytical model), we begin with an initial gas mass equal to the cosmological ratio between baryons and dark matter as Mgi = (Ωb/Ωm)Mh. Subsequently, the total gas mass inhereted by the descendant halo is computed as the leftover gas after stellar and BH processes accompanied by a factor of smoothly accreted gas from the intergalactic medium ( ). We find
  by multiplying the smoothly accreted dark matter mass (
 ) with the cosmological ratio (Ωb/Ωm).
2.2. Star formation, feedback and UV luminosity
The stellar mass produced within each timestep is computed as the effective stellar efficiency (f⋆) times the initial gas mas, i.e.  , where
 ![Mathematical equation: $ f_{\star}^\mathrm{{eff}} = \min[f_\mathrm{{cold}} \cdot f_{\star}^\mathrm{{sphinx}}, f_{\star}^\mathrm{{ej}}] $](/articles/aa/full_html/2026/03/aa56153-25/aa56153-25-eq6.gif) . The fcold and
. The fcold and  are the cold gas fraction and the star formation efficiency retrieved from SPHINX20, respectively. Both quantities depend on the mass and redshift of the halo, and are assigned accordingly. More details on retrieval and tabulation of these values from SPHINX20 simulations can be found in Mauerhofer et al. (2025). The term
  , on the other hand, is the star formation efficiency necessary to eject all remaining gas from the halo by type II SNe (SNII) feedback:
 (1)
(1)
where vc is the halo rotational velocity, ν is the supernova rate ( for a Kroupa initial mass function), and fw⋆ is a free parameter that sets the fraction of SNII energy fraction coupling to gas. Halos where
  are SNII feedback limited, i.e., all their gas gets ejected after SNII; otherwise, they are efficient star formers.
For each galaxy, the intrinsic UV luminosity between 1450–1550 Å ( ) comes from the SED calculated by convolving its star formation history (assuming constant star formation for the stellar mass formed within the 30 Myr timestep) using Starburst99 (SB99) stellar population synthesis code (Leitherer et al. 1999). We adopt the Geneva High mass loss tracks (Meynet et al. 1994), using metallicities of 0.001, 0.004, 0.008 and 0.02 Z⊙. For each galaxy, we interpolate between these values based on its gas-phase metallicity. The observed UV luminosity (
 ) is estimated assuming an internal extinction, corresponding to a homogeneous mixture of stars and dust:
  , where τd is the dust optical depth for a given galaxy (explained in Sect. 2.4).
2.3. BH seeding, accretion, feedback and luminosities
Heavy BHs are seeded in all starting metal-free halos down to redshift 12.8. We randomly draw the initial BH masses from a log-uniform distribution in the 103 − 105 M⊙ mass range. Once seeded, BHs accrete the minimum gas mass between an Eddington fraction (fEdd) or a fraction of the remaining gas after SNII feedback ( ). Hence, the accreted mass is determined as:
![Mathematical equation: $$ \begin{aligned} M_{\rm {BH}}^\mathrm{{acc}} =&\min [(1-\epsilon _r(a))\, f_{\rm {Edd}}\, \dot{M}_{\rm {Edd}}\, \Delta t, \nonumber \\&(1-\epsilon _r(a))\, f_{\rm {acc}}^\mathrm{{BH}}\, M_{g}^{\star }] \end{aligned} $$](/articles/aa/full_html/2026/03/aa56153-25/aa56153-25-eq16.gif) (2)
(2)
where ṀEdd is the Eddington mass accretion of the BH ( ) and ϵr(a) the BH radiative efficiency for a given dimensionless spin a (details in Sect. 2.5). We decide not to split the gas into cold and hot components for BH accretion as we do in star-forming processes, since SPHINX20 does not include AGN physics, and letting BHs accrete from a given component would give rise to inconsistencies with the cold gas fraction sampled from SPHINX20. Both fEdd and
  are free parameters in our models that are implemented with a Gaussian scatter in log-space with a 0.5 dex standard deviation. These parameters can adopt two different values depending on whether the halo mass surpasses the critical threshold
 ![Mathematical equation: $ M_{h}^\mathrm{{crit}}=10^{11.25}[\Omega_m (1+z)^3 + \Omega_{\Lambda}]^{-0.125} (M_{\odot}) $](/articles/aa/full_html/2026/03/aa56153-25/aa56153-25-eq19.gif) (Bower et al. 2017). In our framework, the accretion parameters are largest when Mh ≥ Mhcrit. The physical reasoning behind Mhcrit is that for lower mass halos, star formation-driven outflows would prevent the build-up of gas in the galaxy’s center, inhibiting the growth of the nucleated BH. To reproduce the dispersion of the BH to stellar mass relation found in observations, we apply a gaussian scatter of 0.5 dex in log-space for the Mhcrit threshold that each halo needs to surpass. We chose this magnitude of dispersion (0.5 dex) because it is typically adopted in semi-analytical models that reproduce early galaxy observables (Behroozi et al. 2019; Somerville et al. 2025). We defined the effective Eddington fraction (
(Bower et al. 2017). In our framework, the accretion parameters are largest when Mh ≥ Mhcrit. The physical reasoning behind Mhcrit is that for lower mass halos, star formation-driven outflows would prevent the build-up of gas in the galaxy’s center, inhibiting the growth of the nucleated BH. To reproduce the dispersion of the BH to stellar mass relation found in observations, we apply a gaussian scatter of 0.5 dex in log-space for the Mhcrit threshold that each halo needs to surpass. We chose this magnitude of dispersion (0.5 dex) because it is typically adopted in semi-analytical models that reproduce early galaxy observables (Behroozi et al. 2019; Somerville et al. 2025). We defined the effective Eddington fraction ( ) as the ratio between the accreted gas mass (
 ) and its Eddington mass accretion (
 ) within the timestep.
The strength of BH feedback, i.e., the fraction of energy from BH accretion coupled to winds, is regulated by a free parameter (fwBH), which affects the gas availability in halos. The bolometric luminosity of BHs with  is calculated as
  , where c is the speed of light. This luminosity decays instantaneously in the next Δt. For lower effective Eddington fractions (
 ), models predict a transition from a UV bright, thin disk to a radiatively inefficient, optically thin accretion flow, where the bulk of the thermal energy is carried into the BH rather than being radiated (Narayan & Yi 1994; Yuan & Narayan 2014), therefore their SED changes drastically, with a decrease in the UV/optical regime (Esin et al. 1997; Chiaberge et al. 2006; Younes et al. 2012; Almeida et al. 2018). For this regime of inefficient accretion, we consider BHs to be non-luminous. We find that neglecting inefficiently accreting BHs (
 ) does not impact our results.
2.4. Dust, metal evolution and opacities
In our model, the interlinked evolution of metals and dust are followed using the prescriptions detailed in Dayal et al. (2022) and Mauerhofer & Dayal (2023). In brief, we employ a set of coupled differential equations that describe the production, ejection, and astration of metals and dust, including the growth of dust grains and their destruction into metals via SNII shocks; we assume perfect mixing of metals, dust and gas. At early times (z > 4.5), SNII are the primary drivers of dust production (producing 0.5 M⊙ of dust per SNII); AGB (asymptotic giant branch) stars contribute negligibly (Dayal et al. 2010; Lesniewska & Michałowski 2019). For metal production, we consider the contribution of all SN and AGB stars between 2–50 M⊙, and use the metal yields results from Kobayashi et al. (2020). We employ this mass constraint because stars below 2 M⊙ end their life at longer timescales than the age of the Universe at z > 4.5, while stars > 50 M⊙ are assumed to collapse into BHs without any metal yield. With the incorporation of cold gas fractions, we calculate the destruction and growth of dust grains in the warm and cold ISM, respectively, as detailed in Mauerhofer & Dayal (2023).
Subsequently, we estimate UV opacity for both star formation and BHs. Since dust and gas are perfectly mixed, we equate their distribution to a sphere of radius rgas = rdust. Results from the Atacama Large millimetre Array (ALMA) Rebels survey find a negligible evolution of the effective radii of [CII] 158 μm at a fixed UV luminosity in the 4 to 7 redshift range (Fudamoto et al. 2022). We incorporate this information (tested in Mauerhofer & Dayal 2023) and calculate the evolution of the gas radius as  , where λ is the halo spin parameter with an average value of λ = 0.04 (Dayal 2019), and rvir is the virial radius of the halo. The UV optical depth for star formation is calculated as τgal = 3 Mdust[4π a s rdust2]−1, where Mdust is the total dust mass, and a = 0.05 μm and s = 2.25 gm cm−3 correspond to the size and density of a carbonaceous/graphite dust grains, respectively (Todini & Ferrara 2001; Nozawa et al. 2003).
2.5. BH spins
In this work, we explore the maximal spin scenarios for all BHs to bracket BH mass growth and understand its implications on galaxy and AGN observables. We use the dimensionless definition of the spin a = JBH/Jmax, where JBH is the angular momentum of the BH and Jmax = GMBH2/c its the maximum angular momentum. If a > 0, we consider the BH to co-rotate with the accreting material, whereas a < 0 corresponds to the counter-rotating case. The radiative efficiency (ϵr) is defined as a function of the spin (Bardeen et al. 1972). For this work, we consider three spins for all BHs: Extreme prograde/co-rotating scenario a = 0.99 that yields ϵr = 0.263, extreme retrograde/counter-rotating scenario a = −0.99 that yields ϵr = 0.037, and the “canonical” spin a = 0.67 that yields the radiative efficiency ϵr ≈ 0.1 most commonly assumed in observational work (e.g., Ueda et al. 2014). Since BH accretion ( ) scales as (1 − ϵr(a)) or (1 − ϵr(a))/ϵr(a) depending on the accretion mode, the extreme prograde and retrograde scenario will minimize and maximize the accreted mass, respectively. On the other hand, the bolometric luminosity scales as ϵr(a)/(1 − ϵr(a)) times
  , and therefore it is only on the mode of sub-Eddington accretion that the luminosity scales with ϵr(a).
2.6. BH and galaxy mergers
Whenever two or more dark matter halos with galaxies and BHs merge, we considered two plausible scenarios: (1) instantaneous merging, where DM halos, galaxies and BHs merge instantaneously, and (2) delayed merging, where galaxies and BHs merge after a dynamical friction timescale (Lacey & Cole 1993):
 (3)
(3)
Here, Mh is the mass of the main halo including all satellites, Msat is the halo mass of the merging satellite, τdyn is the dynamical timescale that can be expressed as the half period of a circular orbit for the virial radius of the halo (π Rvir/Vvir = 0.1 π tH(z)), fdf is the efficiency of tidal stripping that we impose to be fdf = 1, and Θorbit is the angular momentum of the satellite halo normalized to a circularized orbit. From Cole et al. (2000) it is found that Θorbit follows a lognormal distribution as ln Θorbit = −0.14 ± 0.26. Hence we randomly draw values for each merger assuming this distribution. In our prescription for delayed merging, satellite galaxies that are orbiting the main system will cease star formation, and their BH (if present) will stop accreting gas.
The dynamical friction timescale τDF must be taken as a lower (i.e. optimistic) limit on the actual time it takes BHs to merge. This is because dynamical friction becomes inefficient at separations of a few kiloparsecs and below (Begelman et al. 1980). Further, sinking from scales of a few to one kiloparsec among the interacting BHs becomes a stochastic process, and it is highly sensitive to the properties of the merging galaxies. These include their stellar mass ratios, stellar masses, morphologies, (Tremmel et al. 2018; Biava et al. 2019; Bortolas et al. 2021), and even the masses of the participating BHs (Pfister et al. 2019). At separations below 100 pc scales, orbital decay is driven by a combination of processes such as dynamical friction against the stellar and/or gaseous density profiles, stellar hardening, gas migration, or third-body interactions (Escala et al. 2005; Haiman et al. 2009; Colpi 2014; Dosopoulou & Antonini 2017; Bonetti et al. 2019). Finally, at sub-pc distances (typically ≈10−4 − 10−3pc for equal mass binaries of 106 − 107 M⊙), gravitational wave driven inspiral dominates and ultimately leads to coalescence (Amaro-Seoane et al. 2023). Naturally, accounting for all these sub-kiloparsec dynamics would increase the delays of BH mergers, and reduce the reported merger rates found in this work, an effect that has been demonstrated in other semi-analytical models works (Bonetti et al. 2019; Barausse et al. 2020).
Moreover, since BHs in our prescription merge instantaneously or after τDF, we do not account for the possibility that they become wanderers, BHs that never merge with the main BH. A growing number of studies report that wandering BHs can represent a significant fraction of the total BH population (Ricarte & Natarajan 2018; Tremmel et al. 2018; Izquierdo-Villalba et al. 2020; Bellovary et al. 2021; Di Matteo et al. 2023; Chen et al. 2022). For now, we limit this work to the most optimistic scenario for BH mergers, in which mergers occur as efficiently as our dark matter merger tree resolution allows. This assumption maximises the predicted BH merger rate and facilitates the early growth of massive BHs, as suggested by recent JWST results. Nonetheless, incorporating more realistic sub-kiloparsec timescales remains a key goal for future iterations of this model.
We considered the fiducial model as the one that assumes instantaneous merging of galaxies and BHs and a canonical radiative efficiency of ϵ = 0.1, which yields a spin of a = 0.67 (see Section 2.5). A summary of the models explored in this work can be found in Table 1.
Models explored in this work.
3. Calibrating against observations
We calibrate the fiducial model against galaxy and AGN observables. The observables we consider are the UVLF of Lyman Break Galaxies (LBGs) at redshifts z ∼ 5 − 14 (Bouwens et al. 2022, 2021; Harikane et al. 2022, 2023a; Atek et al. 2015, 2018; Adams et al. 2022, 2024; Donnan et al. 2022, 2024; Bowler et al. 2017; Leung et al. 2023; Finkelstein et al. 2024; Willott et al. 2024; Robertson et al. 2024; Whitler et al. 2025), the stellar mass function (SMF) at z ∼ 5 − 10, 12 (Navarro-Carrera et al. 2024; Song et al. 2016; Duncan et al. 2014; Bhatawdekar et al. 2019; Stefanon et al. 2021; Harvey et al. 2025), the BH mass function (BHMF) at z ∼ 5 − 6 (Kokorev et al. 2024; Matthee et al. 2023), and the bolometric luminosity function at z ∼ 5 − 8 (Kokorev et al. 2024; Akins et al. 2025a). We deliberately exclude pre-JWST AGN data, as they predict 10 − 100 times smaller number densities for the (extrapolated) bolometric LF at the faint end compared to JWST results. We also do not consider the ultraviolet LF, given the undetermined contribution from their galaxy host (Pérez-González et al. 2024; Rinaldi et al. 2025), or a possible contribution from scattered unreddened UV light from the AGN (Greene et al. 2023; Kocevski et al. 2024; Kokorev et al. 2024). In a future paper, we will explore the observed UV LF compared to observations, assuming different attenuation laws and Hydrogen column densities. For the next subsections, we describe how we chose the best parameters for the fiducial model to reproduce JWST observables. Afterward, we show how our models compare to the bolometric LF and BHMF of AGNs. The errors for each model are calculated for each mass (luminosity) bin, assuming a Poisson Error weighted by the number density of the halos found at the corresponding bin, following the formalism presented in Bohm & Zech (2013). We refer the reader to Appendix B for details in the calibrated galaxy observables.
3.1. Finding the best parameters for the fiducial model
To find the best parameters that simultaneously fit all observables, we perform a parameter exploration over all the free parameters in Delphi, namely:  , fwBH, fEdd(Mh < Mhcrit), fEdd(Mh ≥ Mhcrit),
  ,
,  . The range of values explored is detailed in Table B.1, amounting to a total of approximately 6200 models. For each run, we constructed the SMF and UVLF for LBGs and the BHMF and the bolometric LF for AGNs.
For each observable, we compute the chi-square statistic against available observations at multiple redshifts (see Table B.2). During this calculation, we avoid data points that are lower or upper limits1. To characterize the overall performance for each observable, we sum the chi-square values across all redshifts, resulting in a chi-square distribution (see Fig. B.1) per observable (SMF, BHMF, UVLF of LBGs, and bolometric LF).
To select the best-fitting parameters, we pre-select all models that fall within the 38th percentile of the chi-square distribution for each observable. We choose this specific percentile because it selects a small number (N = 6) of models that show good overall performance across datasets. From this subset, we identify the model with the smallest total sum of chi-square values across all observables as our best-fit model. The best parameters are shown in Table 2.
Best-fit free parameters for the fiducial model.
3.2. Bolometric luminosity function
The bolometric luminosity function (bolometric LF) is shown in Fig. 1 for z ∼ 5 − 7 and 10. We remind the reader that only the fiducial model (black solid lines) have been calibrated against observational data. The shaded regions around each theoretical model show their Poisson errors, weighted by the number density of BHs with a bolometric luminosity corresponding to each bin. The del-sp099 and ins-sn099 models correspond to the lower and upper bounds of BH growth and luminosity, respectively. Observations pre-JWST are represented with the LF fits from Shen et al. (2020), shown as the dot-dashed gray lines. JWST observations at redshifts 5 − 10 come from Greene et al. (2023), Kokorev et al. (2024), Matthee et al. (2023), Akins et al. (2025a), Lin et al. (2024) and Kovács et al. (2024).
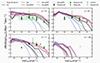 |
Fig. 1. Bolometric luminosity functions for AGNs for redshifts 5, 6, 7 and 10. The instantaneous models are shown as solid lines, while the delayed models are shown as dashed lines. The shaded areas for each model correspond to their Poisson errors. The fiducial model (ins) and delayed (DEL) are shown in black, the extreme retrograde are shown in pink and the extreme prograde in blue (del-sp099). Observations pre-JWST are represented by the fits from Shen et al. (2020) (green dash-dot lines). JWST results are from Greene et al. (2023), Kokorev et al. (2024), Matthee et al. (2023), Kovács et al. (2024), Akins et al. (2025a), Lin et al. (2024). |
We summarize how each observational work estimated AGN bolometric luminosities, highlighting their key assumptions and caveats. Greene et al. (2023) selected high-z (z > 4) AGN candidates via photometry based on the LRD criteria, being compactness and a characteristic “v”-shaped SED. They confirmed the presence of an AGN by detecting broad Hα in their NIRSpec spectra. Assuming the observed UV corresponds to scattered (or leaked) AGN emission, they correct for dust using the observed UV slope and estimate the bolometric luminosities using standard relations (Greene & Ho 2005). Kokorev et al. (2024) also used the LRD photometric criteria and performed a two-component SED fitting, where the UV/optical comes from the Sloan Digital Sky Survey (SDSS) composite quasar SED Vanden Berk et al. (2001) and the NIR comes from Glikman et al. (2006). In this template, they consider a dust reddened SED alongide a non-attenuated emission arising from scattered light. The bolometric luminosity is derived using the luminosity at 5100 Å and the corresponding standard relations (Greene & Ho 2005; Kaspi et al. 2000). Akins et al. (2025a) photometrically selected compact red sources and fitted quasar-only SEDs with up to 10% scattered, unattenuated UV emission. Bolometric luminosities were derived from the monochromatic luminosity at 3000 Å of their best SED fit, using the bolometric corrections from Richards et al. (2006). Lin et al. (2024) photometrically searched for broad Hα in compact, red sources, from which they estimated L5100 (Greene & Ho 2005) and the corresponding bolometric luminosity (Richards et al. 2006). They do not apply dust corrections due to their limited spectral coverage, potentially underestimating the bolometric LF by 0.4–0.8 dex if AV = 2 − 4. Finally, Kovács et al. (2024) estimated the bolometric LF using two of z ∼ 10 galaxies (Kovács et al. 2024; Bogdan et al. 2023), identified via CHANDRA soft X-ray emission. The bolometric luminosities were derived using Lusso et al. (2012) corrections.
To reproduce the JWST-AGN bolometric LF while maintaining consistency with galaxy observables, our models require accretion parameters of fEdd = 1 (10−3) and  in halos above (below) the critical threshold. It is important to consider that in D19, the accretion parameter
  did not have two different values depending on the critical mass threshold, as BH growth in low-mass halos was effectively suppressed. Hence, our current prescription extends the framework by allowing low mass halos to contribute on BH growth via accretion whenever there is sufficient gas. Compared to D19, which was calibrated to pre-JWST high-z AGN surveys, our accretion parameters above the critical halo mass threshold are ≈1–2 orders of magnitude higher2. This means that BHs in large halos (Mh ≥ Mhcrit) must at least accrete 10% of the remaining gas after SNII feedback, i.e. ∼100 times more gas than in D19. At the same time, in our updated framework, BHs in small halos (Mh < Mhcrit) have to accrete at least ∼0.1% of gas after stellar processes. Both D19 and this work impose Eddington limited (fEdd = 1) growth for high mass halos (Mh > Mhcrit). It is important to note that in D19, the parameters for BH accretion and the critical halo mass threshold (Mhcrit) for a given halo were not implemented with a 0.5 dex gaussian scatter in log-scale, and hence we achieved a smoother transition between fractions that yield high (fEdd = 1 and
  ) and low accretion (fEdd = 10−3 and
  ).
).
Nonetheless, incrementing the parameters for BH accretion, as well as setting heavy initial BH masses results in strong BH feedback, which is counteracted by a weaker value of BH feedback coupling onto winds (fwBH = 5 × 10⁻⁴), of about an order of magnitude lower than in D19, reporting fwBH = 0.003. Consequently, this elevated accretion accelerates the assembly of heavy, 106 − 109 M⊙ accreting BHs, shining with luminosities between 1042 − 1047 erg s−1, which boosts the number densities of BHs in this mass and luminosity regime. Additionally, the incorporation of SPHINX20 cold gas fractions and star formation efficiencies results in a drastic diminution of SNII feedback limited halos (i.e. halos with no gas after SN feedback). Before incorporating the values from SPHINX20, in DELPHI, 96.06% (99.92%) of halos at redshift 5 (10) were completely devoid of gas following stellar and BH feedback. After the update, this fraction has significantly decreased to 0.11% (9.63%) for redshifts 5 (10). This change primarily facilitates the growth of BHs in low-mass halos by allowing continued gas accretion, thereby accelerating their assembly.
We now discuss the evolution of the bolometric LF shown in Fig. 1, moving from high to lower redshifts. Across all panels, the interplay between BH accretion rates, spin configurations, and merging prescriptions determines the shape and normalization of the LF, though their relative importance evolves with redshift.
At z = 10 (bottom-right panel), models with instantaneous mergers (ins, ins-sn099, ins-sp099) reach higher number densities across the entire luminosity range compared to the delayed models (del, del-sn099, del-sp099). This stems from the accelerated BH growth by immediate BH-BH coalescence; this allows them to grow even faster once their halos are massive enough to retain gas after SNII feedback. Most BHs in this luminosity regime (≥1042.5 erg s−1) accrete in the fEdd-regulated mode, where accretion scales with BH mass. Additionally, the impact of spin is evident: more negative spins result in higher number densities at the bright end ≥1044.4 erg s−1 (1043.2 erg s−1) of the bolometric LF for instantaneous (delayed) models. The latter is due to the low radiative efficiency and thus the higher mass accretion rates that more negative spins yield (see Eq. 2). However, none of our models approach the high number density estimated by Kovács et al. (2024), with even our upper bound model (ins-sn099) underpredicting this prediction by more than 5 dex. We interpret this rare, bright sources as outliers relative to the AGN population our models aim to describe. At z = 7 (bottom-left), spin strongly modulates the shape of the bolometric LF. Models with extreme retrograde spin (ins-sn099, del-sn099) yield the highest number densities at luminosities > 1045 erg s−1, followed by the canonical and extreme retrograde spin. This hierarchy reflects how more negative spins boosts accretion rates and hence BH mass and luminosity. Instantaneous models remain consistently more number dense than their delayed counterparts at fixed spin due to their enhanced merger-driven growth and gas availability (supplemented from satellite galaxies). Interestingly, at fainter luminosities < 1043.8 erg s−1, extreme prograde spin models (ins-sp099 and del-sp099) report slightly higher number densities, as their slow growth via accretion leads to an abundant population of low-luminosity BHs. When compared to JWST data (Akins et al. 2025a; Kokorev et al. 2024; Greene et al. 2023), models with extreme retrograde spin (ins-sn099 and del-sn099) match the bright-end number densities ≈10−5 − 10−6 cMpc−3 dex−1 at 1045 − 1046 erg s−1. The fiducial model agrees well up to luminosities of 1045 erg s−1, but under-predicts brighter bins by 0.9–3.2 dex. Miss-matches on some datasets are expected since the best-fit parameters are tuned to match both galaxy and AGN observables simultanously. At z = 6 (top-right), both spin and merging prescriptions, particularly at luminosities ≳1044 erg s−1, determine the shape of the LF. The order in which models reach higher number densities for brighter luminosities remains consistent with that of z = 7, highlighting the sustained role of spin-enhanced accretion. At the faint end, however, delayed and instantaneous models overlap within uncertainties. This convergence is driven by the following: delayed models maintain high accretion rates ( ) for small BHs (≈105 − 6.5 M⊙) due to their weaker feedback retaining more gas. Whereas, instantaneous models rapidly assemble massive BHs ≈107.5 − 8 M⊙, which yield stronger feedback that effectively restricts their gas supply, lowering accretion rates (
 ) and thus populating the faint end of the bolometric LF. Delayed models also benefit from increased merger rates at this redshift, enabling BH growth via mergers as well as further gas accretion from the gas provided by the incoming satellite galaxy. The fiducial model shows its best match to observations at 1045 − 46 erg s−1, slightly under-predicting the data by up to 0.7 dex at brighter luminosities.
By z = 5 (top-left), the LF shows a narrowing gap between delayed and instantaneous models at fixed spin, particularly in the extreme retrograde case (ins-sn099 vs del-sn099), which are nearly indistinguishable across 1044.3 − 47.2 erg s−1. This convergence arises from the increasing merger rates that delayed models experience at lower redshifts, which grow their BHs via BH-BH mergers as well as replenishes the available gas for further accretion. Consequently, delayed models “catch up” to instantaneous ones in bolometric luminosities, especially for spin configurations that maximize accretion. Interestingly, while most models with the same merging prescription overlap at the faint end (≤1044 erg s−1), ins-sn099 displays a distinct convex shape due to the buildup of ∼109 M⊙ BHs from prolonged, high accretion. Comparing to observations, the fiducial model now overpredicts the data by 0.22–1.6 dex depending on the luminosity bin. This suggests that models matching well at z = 6–7 may overestimate the AGN population at later-epochs, possibly reflecting on observational incompleteness of z = 5 AGNs, redshift evolution of AGN obscuration, or model limitations of BH quenching at later times (z < 6).
3.3. BH mass function
In Fig. 2, we show the BHMF for redshifts 5 and 6. The ins-sn099 and del-sp099 models correspond to the upper and lower bounds of BH growth. The faint and thin lines correspond to the mass function of all BHs, while for the fiducial and DEL model we show the BHMF for BHs ≥1044 erg s−1 with  in the thick and saturated lines. The choice for the latter constraint is motivated by the faintest luminosity and Eddington fractions probed from spectroscopic JWST observations (Matthee et al. 2023; Greene et al. 2023).
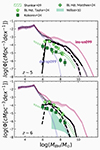 |
Fig. 2. Black hole mass functions at redshifts 5 and 6 for the fiducial (solid black lines), DEL (dashed black lines), ins-sn099 (solid pink lines), and del-sp099 (dashed blue lines). The thin lines represent all BHs, while thick lines show BHs with LBol ≥ 1044 erg s−1 and |

Pre-JWST predictions for the BHMF come from Shankar et al. (2009), while direct BHMF estimations are from Willott et al. (2010a). The former derives the BHMF using a reference model of BH evolution where BHs accrete at 0.6 Eddington fraction and a radiative efficiency of ϵ = 0.065. They calibrate the BHMF so it reproduces the bolometric luminosity functions of AGNs available at that time. In the panel at redshift 5 we show Shankar et al. (2009) reference model for redshifts 4.5–5, while at redshift 6 we show their predictions between redshifts 5.51–5.99. Meanwhile, the latter estimates the BHMF so it can reproduce the luminosity functions in Willott et al. (2010b), considering an intrinsic Eddington distribution for z ≈ 6 sources, an obscured fraction and a duty cycle of ∼0.75. Regarding JWST observations, Matthee et al. (2023) constructed the BHMF for redshift bins 4 − 6 using single-epoch measurements of broad Hα in their LRD sample. Kokorev et al. (2024) estimated the BHMF at redshift bins 4.5 − 6.5 for their photometrically selected LRD sample using their bolometric LF and assuming that all their sources are shining at the Eddington limit. Finally, Taylor et al. (2025) constructed the BHMF at redshift bins 3.5 − 6 by calculating the single-epoch BH mass from their sources with detectable broad Hα in slitless spectroscopy. Out of this sample, they find that ∼30% satisfy the LRD criteria. Given the complexity of SED modeling, they decide not to incorporate corrections from dust attenuation.
At redshifts 5 and 6, we see a somewhat flat distribution of BHs between 103 − 105 M⊙ masses for all displayed models. This shape comes from the log-uniform distribution of BH seeds seeded at starting halos down to redshift ≈13. Through cosmic time, these BHs are starving or accreting at sub-Eddington fractions in small halos (Mh < Mhcrit), which easily eject all their gas from stellar and BH feedback. In the high-mass counterpart, the overall shape of the BHMF is mainly subject to spin prescription, i.e., the accretion rate and the gas availability. Meanwhile, in the case of models with canonical spin, we see that the delayed and instantaneous models overlap within error bars for BH masses below 108.5 M⊙ (107 M⊙) for redshifts 5 (6). Indeed, through instantaneous merging, the number density of massive BHs (≥108 M⊙) are at least 0.3 dex more numerous than the delayed, due to efficient merging and accretion from the maximum amount of gas possible brought in by satellite galaxies.
Comparing to JWST observations, we see that at redshift 6 (bottom panel of Fig. 2), the fiducial model finds good agreement with the data points from Taylor et al. (2025), while for Kokorev et al. (2024) we overpredict the number densities by 0.7–1.27 dex. Even after masking by bolometric luminosity (LBol ≥ 1044 erg s−1) and Eddington fraction (fEdd ≥ 10%), we overpredict Kokorev et al. (2024) points by 0.26–1.11 dex. Whereas at redshift 5, the masked BHMF of the fiducial agrees with Taylor et al. (2025) between 106.25 − 107.25 M⊙, and overpredicts by 0.59–1 dex at higher masses, while for Matthee et al. (2023) and Kokorev et al. (2024) we overpredict the number densities at all mass ranges by 0.43–1.19 dex and 1–1.9 dex, respectively. Regarding pre-JWST observations, as expected, we overpredict the number density by at least 1 dex at all mass ranges for redshifts 5 and 6.
Although the fiducial model tends to overestimate most data points, it is important to consider that the BHMF estimation from Kokorev et al. (2024) does not account for the underlying distribution of Eddington fraction, which is set to 1. Therefore, assuming an average Eddington fraction of 10% would shift these data points to the right by 1 dex, comfortably matching the BHMF of the fiducial model. On the other hand, both BHMF estimated from Matthee et al. (2023) and Taylor et al. (2025) are built using single-epoch measurements of broad Hα, which are uncertain to be valid for sources accreting above or close to the Eddington limit (Lupi et al. 2024; King 2024). Additionally, they do not correct for dust attenuation. Hence, the estimations for BH masses may be underestimated. At the same time, accounting for type II AGN may increase the number density by up to 0.6 dex (Maiolino & Rieke 1995), if the proportion of type II over type I found at low-z stands at these high-z.
4. Emergence of black holes in the first gigayear
In this section, we describe and discuss the emergence of BHs and their host galaxies from 0.125 Gyr (z = 26) up to 1.2 Gyr of the Universe (z = 5), spanning the first billion years in cosmic time. We compare the configurations presented in this work (see Table 1) and analyze their impact on the stellar to BH mass relation, as well as their expected merger rates.
4.1. Stellar and BH mass relation
From observations we have BH and stellar masses that range between log(MBH/M⊙)=[6 − 9.5] and log(Mstellar/M⊙)=[7.5 − 11.6], and from redshifts 5 to 10. Most BH masses were estimated using single-epoch measurements of broad Hα (Harikane et al. 2023b; Maiolino et al. 2024; Kocevski et al. 2023, 2024; Akins et al. 2025b; Rinaldi et al. 2025), Hβ (Yue et al. 2024; Kokorev et al. 2023; Furtak et al. 2024; Tripodi et al. 2025; Kocevski et al. 2024), or MgII (Pensabene et al. 2020) depending on the spectral coverage. Other works (Kovács et al. 2024; Bogdan et al. 2023) derive BH masses from X-ray emission found in CHANDRA, assuming an Eddington limited accretion and X-ray bolometric corrections (Lusso et al. 2012; Duras et al. 2020). The stellar masses for some of these observations are estimated by SED fitting the photometric points of host-only images (Harikane et al. 2023b; Ding et al. 2023; Yue et al. 2024), i.e. on the residual images after subtracting the PSF contribution of the quasar. Other stellar masses are derived from SED fitting the photometric and/or spectroscopic data of the complete source with (Maiolino et al. 2024; Kokorev et al. 2023; Kocevski et al. 2023, 2024; Tripodi et al. 2025; Akins et al. 2025b; Rinaldi et al. 2025) and without (Bogdan et al. 2023; Kovács et al. 2024; Furtak et al. 2024) an AGN component. For the case of Pensabene et al. (2020), they measure the dynamical mass using the CII interstellar medium tracer from ALMA observations.
Starting at redshift 10, in the right panel of Fig. 3, we see galaxies and BHs in the fiducial model scattered along a slightly shallower slope compared to the local relation for Elliptical and Spheroidals (Reines & Volonteri 2015). Around 8.35% of galaxies Mstellar ≲ 108 M⊙ hold non-accreting BHs. These systems are located in small halos that easily expel all their gas via SNII feedback. The rest of these galaxies at this regime and higher have sufficient gas (after stellar feedback) for their BH to accrete, at a fraction that increases toward higher stellar masses. The largest BHs (≈107 M⊙) at this time are located in the rarest and most massive halos (10−10 cMpc−3). For DEL we find a similar trend but with a shallower slope than the fiducial, scattered down toward smaller BH masses. This results from BHs in the DEL model having a slower growth via mergers, consequently resulting in smaller initial masses once they start accreting. Unlike the fiducial model, the rarest halos in DEL achieve BH masses that barely exceed 106 M⊙. We also note how the addition of a dynamical timescale for BH and galaxy mergers becomes more impactful for growing massive BHs (> 106 M⊙) rather than massive galaxies. This can be understood since star formation processes occur in halos at all redshifts and mass ranges, as opposed to BHs only being present in starting halos down to z = 13, with efficient growth via accretion only at high mass systems (Mh ≥ Mhcrit).
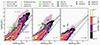 |
Fig. 3. Stellar to BH mass relation for the fiducial (shaded contours) DEL (line contours), ins-sn099 and del-sp099 models at redshifts 5, 7 and 10. Here, we present the relation as contours from a smoothed 2D histogram, weighted by their associated number density. In all panels, we show the scaling relations for local Elliptical and Spheroidals (solid black line) (Reines & Volonteri 2015), high redshift galaxies (z ∼ 2.5) (Suh et al. 2020) (dash-dotted black line), and the relation for high-redshift (z = 4–7) AGNs using only JWST sources (Pacucci et al. 2023) (dashed black lines). Observations pre-JWST come from works of Pensabene et al. (2020), and the latest results from JWST from Maiolino et al. (2024), Harikane et al. (2023b), Yue et al. (2024), Bogdan et al. (2023), Rinaldi et al. (2025), Tripodi et al. (2025), Larson et al. (2023), Kokorev et al. (2023), Akins et al. (2025b) and Kovács et al. (2024). |
The observational data points available at this extreme redshift are from Maiolino et al. (2024), and gravitationally lensed galaxies (Bogdan et al. 2023; Kovács et al. 2024). The latter two works report overmassive BHs with respect to their host galaxy, comprising ≈10% of the stellar component, as opposed to ≈0.01% from local relation predictions (Reines & Volonteri 2015). We can only obtain systems such as the one from Maiolino et al. (2024), while we fail to reproduce sources as in Bogdan et al. (2023) and Kovács et al. (2024). Not even our model with extreme retrograde (ins-sn099) can reach such extreme sources. As mentioned in the previous sections, our theoretical framework aims to reflect upon the general population of BHs rather than these extreme cases. Nonetheless, a potential mechanism that can help to reach these elevated masses is to include prescriptions of Super-Eddington accretion (Lupi et al. 2024).
Around 300 Myr later, at z ∼ 7, as shown in the middle panel of Fig. 3, the fiducial model is scattered at a comparable slope with local relations for Ellipticals and Spheroidals, reaching BH masses of ≥109 M⊙ in massive galaxies (≥1011 M⊙), located at the rarest halos (≤10−10 cMpc−3). At this time, 1.14% of galaxies below 108.29 M⊙ harbor non-accreting BHs driven by growth via mergers, while the rest additionally grow from accretion. Meanwhile, the DEL model is scattered at a slightly shallower slope relative to the fiducial, growing BHs up to ∼108.5 M⊙ in the rarest halos (≤10−10 cMpc−3). The steady increase of merging halos in the DEL model, allows the main system to increase its stellar, and BH components (if a BH is present) from satellite galaxies. Furthermore, as shown in previous work (Piana et al. 2020, 2021), BH accretion becomes the main driver of BH growth in massive haloes that surpass the critical halo mass threshold. At this stage, accretion contributes up to an order of magnitude more mass than mergers. The extent to which accretion dominates over mergers depends on the halo’s individual merger history and its final mass at the end of the simulation. For instance, in the fiducial, haloes that grow to log(Mh/M⊙)=10.5 − 11 by z = 4.5 host BHs that stochastically grow from mergers, with accretion contributing an average of 37% of the total BH mass by z ∼ 5. In contrast, halos that reach log(Mh/M⊙)=12.5 − 13 (13.5 − 13.9) by z = 4.5 host BHs whose masses are on average 98 (91)% of their BH mass built through accretion events. We refer the reader to Piana et al. 2020, 2021 for a detailed analysis of the relative contributions of mergers and accretion across redshifts. Notably, in the current model, where SN feedback-limited systems are far less common than in earlier versions of the DELPHI, most satellite galaxies retain sufficient gas to further BH accretion.
Regarding observations, we find the fiducial model in agreement with only some JWST data points (Yue et al. 2024; Maiolino et al. 2024; Harikane et al. 2023b; Kocevski et al. 2024; Larson et al. 2023; Tripodi et al. 2025), while for the rest we are unable to reproduce such overmassive BHs at a given stellar mass (Kokorev et al. 2024; Kocevski et al. 2024; Akins et al. 2025b). However, we do note that many of the data points that the fiducial does not reproduce are within the maximum limit of BH growth from the extreme retrograde model (ins-sn099).
Roughly 500 Myr later, at redshift 5 (left panel of Fig. 3), we note that BHs in galaxies above 109.8 M⊙ in the fiducial model experienced significant growth with respect to the previous redshift. At this point, 2.24% of galaxies ≲1010.81 M⊙ have no gas after BH and stellar feedback. Meanwhile, most BHs in galaxies with stellar mass above 109 M⊙ lie below the 0.69 dex scatter of the JWST high-z relation (Pacucci et al. 2023), but 7.05 × 10⁻⁵ cMpc−3 (0.16%) of them are found above the 0.55 dex scatter of the local relation from Ellipticals and Spheroidals (Reines & Volonteri 2015). Although these overmassive BHs (108 − 1010 M⊙) are a minority (< 1% of the population), the sustained elevated accretion rates pose a complicated scenario for these systems to agree with local (z ≈ 0) relations. Under our cosmological constants, at redshift 5 the Universe has a comoving volume of 2111.765 Gpc, which means that our most extreme BH sources ≥1010 M⊙ associated to the rarest number densities ≲10−6 cMpc−3 lead to a maximum number of ≈2 × 10⁷ overmassive sources. Therefore, additional mechanisms are required to quench effectively the BH growth in high mass systems (Mstellar > 1010 M⊙), than those already incorporated in the fwBH parameter that regulates the wind coupled energy.
Concerning the differences between the fiducial and DEL model demographics, these are indistinguishable for stellar masses below 1010 M⊙ harbouring BHs ≥108 M⊙ (also reflected in Fig. 2). The increase of mergers in the DEL model allows small galaxies to grow their BHs from mergers, whereas satellites merging in large galaxies would additionally provide a reservoir of gas that boosts star formation and BH accretion. Again, the fiducial agrees with some observations except those found in Maiolino et al. (2024), Kocevski et al. (2024), which notably deviates from local relations, while partially cross-matching within the 0.69 dex scatter from the proposed relation from Pacucci et al. (2023) for high-z JWST-AGNs. Nonetheless, our model of extreme BH growth (ins-sn099) is able to cover the overmassive BHs from Kocevski et al. (2024), while only partially reaching those from Maiolino et al. (2024).
4.2. Merger rates in the first gigayear
In this section, we calculate the raw merger rates for BHs in all the models explored in this work (see Table 1), i.e. without filtering by the sensitivity of future gravitational observatories such as LISA or ET. We compare our results with previous predictions found in literature. We begin calculating the merger rates as a function of redshift, using the following expression (Arun et al. 2009):
![Mathematical equation: $$ \begin{aligned} \frac{d^2 N}{dz dt } = \frac{4 \pi c}{\Delta z} \sum _{N \in \Delta z} n(z) \left( \frac{d_L(z)}{1+z} \right)^2 [\mathrm {yr}^{-1}] \end{aligned} $$](/articles/aa/full_html/2026/03/aa56153-25/aa56153-25-eq43.gif) (4)
(4)
Here n(z) is the number density of mergers at redshift z (derived from the host halo), and dL is the luminosity distance at a given redshift. Since the merging timescale for galaxies and BHs solely depends on the mass ratios between their dark matter halos, varying the values for BH spin has no impact on the merger rates as a function of redshift. Therefore we show the merger rates as a function of z distinguished by the merging timescale only.
In Fig. 4 we show in the upper panel, the cumulative raw merger rates in units of yr−1 up to redshift 5 for all BHs in the instantaneous (solid line) and delayed models (dashed line), while in the lower panel we show the merger rates for a given redshift bin as a function of redshift (Eq. (4)). In the upper panel we see that the instantaneous models reports a total of 28.06 merger events per year for z ≥ 5, while the delayed reports 19.61 mergers per year. In the lower panel, we note that the delayed models start to merge more frequently (> 1 yr−1) at redshift below 10.5, whereas the instantaneous report such frequencies as early as redshift 14.
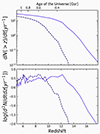 |
Fig. 4. Raw merger rates as a function of redshift. In the upper panel, we show the cumulative merger events for BHs per year as a function of redshift, and in the bottom are the merger rates at a given redshift bin. Instantaneous models are shown as solid lines, while delayed models are indicated with dashed lines. |
Merger rate predictions for heavy BH seeds are explored in previous works in the literature (Sesana et al. 2007; Bonetti et al. 2019; Barausse et al. 2020; Klein et al. 2016; Dayal et al. 2019). Most of these estimations are based on the formation of heavy seeds from dynamical instabilities as presented in Begelman et al. (2006) and Volonteri et al. (2008), where a heavy seed is formed after the rapid growth of a quasi-star, or as in Koushiappas et al. (2004), where large BHs form as a Direct Collapse within halos with gas regions of low angular momentum. Dayal et al. (2019), on the other hand, explores the formation of DCBHs in Atomic Cooling Halos (ACHs) exposed to a critical Lyman Werner (LW, at 11.2 − 13.6 eV) background. We caution the reader that our seeding mechanism for BHs only requires metal free starting halos found at reshifts ≈13 and above. Hence, the number density of seeds is subject to the resolved 108 M⊙ halos in pur DM merger tree halo. For a more detailed comparison between the number densities of the BH seeds in other works, we refer to the Appendix A.
From Sesana et al. (2007), we found merger rates ranging from 2 to 182 yr−1 at z > 5 when varying the efficiency of metal enrichment and the prescriptions for heavy seed formation. Similarly, we find that Klein et al. (2016) obtains 3 − 88 yr−1 events at z > 5 considering delayed and instantaneous merging. Bonetti et al. (2019) finds agreement with the works mentioned, with a total of ∼23 yr−1 mergers for heavy seeds at z > 0 in their delayed model, including sub-kiloparsec evolution of binary BHs within a stellar or gaseous environment, including the interaction with a possible third BH. From Barausse et al. (2020), we found merger rates ranging from 0.2–2441 yr−1 at z > 5 in their models with SN feedback, while exploring different delay timescales and instantaneous merging. Katz et al. (2020) report a range of 0.007 − 75 yr−1 events for BH seeds in the 105 − 106 M⊙ mass range from the Illustris cosmological simulation at z > 5, considering both post-processed delays (Kelley et al. 2017) and no delays. D19 predicts merger rates of at most 0.02 yr−1 for heavy seeds at z > 5 in their model assuming instantaneous merging and a LW background of 30 J21. Finally, we compared the merger rates with the recent work from Liu & Inayoshi (2025), which uses an analytical model to reproduce JWST LFs for AGNs at z = 5 using a mixture of heavy and light BH seeds. They report merger rates for z > 5 of 0.1 yr−1 for heavy seeds and 32 yr−1 for the mixture of seeds.
We calculated the merger rate as a function of redshifted merged BH mass Mz, BH = (1 + z)MBH. Here, MBH corresponds to the total mass of the BH merger and z the redshift at which the merger event occurred.
![Mathematical equation: $$ \begin{aligned} \frac{d^2 N}{dM_{z,\mathrm{{BH}}}\, dt} = 4 \pi c \sum _{N \in \Delta M_{z, \mathrm{{BH}}}} n(M_{z,\mathrm{{BH}}})\, \left( \frac{d_L(z)}{1+z} \right)^2 [\mathrm{{yr}}^{-1}] \end{aligned} $$](/articles/aa/full_html/2026/03/aa56153-25/aa56153-25-eq44.gif) (5)
(5)
where n(Mz,BH) is the number density associated to the redshifted merged BH mass. We show the redshifted observed merged BH mass in Fig. 5 for all models presented in Table 1. The dashed lines correspond to the delayed models, while the solid lines are for the instantaneous models. Each curve is colored according to its spin configuration.
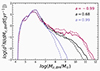 |
Fig. 5. Merger rate events per year as a function of redshifted merged BH mass for all of our models. Dashed lines correspond to the delayed models (DEL, del-sp099, del-sn099), and the solid lines represent the instantaneous (fid, ins-sp099, ins-sn099). |
We start discussing the distribution that each model predicts on the observed redshifted BH mass shown in Fig. 5. For redshifted BH masses of Mz, BH ≤ 106.7 M⊙ models with the same merging timescale, regardless of spin, exhibit overlapping distributions in merger rates. This agreement arises because these small BHs reside in small systems, where accretion is limited, making mergers the dominant growth channel. For Mz, BH > 106.3 M⊙ models begin to diverge. As expected, models with extreme prograde reach lighter redshifted masses at the high mass end, surpassed by the fiducial and the extreme retrograde. For a given spin, models with an instantaneous prescription populate toward heavier redshifted BH masses, compared to the corresponding delayed model. Moreover, the discrepancies between instantaneous and delayed models at a given spin become less pronounced toward more negative spins. For instance, at a fixed merger rate of 10−2 yr−1, the redshifted BH mass reaches Mz,BH/M⊙ ≈ 108.72(108.23) for ins-sp099 (del-sp099), ≈1010.52(1010.09) for the fiducial (DEL), and ≈1011.25(1011.15) for ins-sn099 (del-sn099). Understandibly, accretion rates increases toward negative spins, accelereting BH mass growth through cosmic time, and partially compensating for the setback growth that delayed merging yields.
When comparing our fiducial model against the previous literature (Sesana et al. 2007; Bonetti et al. 2019; Barausse et al. 2020; Klein et al. 2016; Katz et al. 2020), we find that our distribution of merger rates as a function of redshifted BH mass show similarities among those who report relatively high merger rates for heavy redshifted BH mass (Klein et al. 2016; Katz et al. 2020; Barausse et al. 2020), with a prominent peak around Mz, BH ∼ 106 M⊙, which extends to 109 M⊙ for merger rates of ≈0.1 yr−1. Nonetheless, it is not straightforward to draw a detailed comparison among these works, since at times they employ different signal to noise cuts corresponding to LISA’s detectability, and consider merger rates down to redshift 0.
5. Discussion and conclusions
In this work, we have addressed the merger rates of BHs in the first gigayear of the Universe in light of the overabundance of AGNs as reported from recent JWST discoveries (Maiolino et al. 2024; Harikane et al. 2023b; Greene et al. 2023; Kokorev et al. 2024; Matthee et al. 2023; Akins et al. 2025a; Yue et al. 2024). We used DELPHI, a semi-analytical model, that tracks the assembly of galaxies and BHs over a hierarchical evolution of dark matter halos. In our models, we seeded heavy BH seeds (103 − 105 M⊙) for each starting halo down to redshift ≈13, which accretes efficiently (at the Eddington limit) once the halo surpasses a critical threshold (Bower et al. 2017). Heavy seeds have become, among others (Lupi et al. 2024), one of the leading models to explain the observed massive AGNs at high redshifts (z ≈ 4 − 10). In this work, we have explored models with instantaneous and delayed merging (from dynamical friction using Lacey & Cole (1993)) between galaxies and BHs, as well as different spin configurations: canonical (a = 0.67), maximal prograde (a = +0.99) and maximal retrograde (a = −0.99) (see Table 1). We set the fiducial model as the one with instantaneous merging and canonical spin. For the fiducial model, we explored the parameter space in DELPHI and selected the parameters (see Table 2) that simultaneously best fit the UVLF, SMF for LBGs, and the BHMF as well as the bolometric LF of AGNs from JWST discoveries. These optimised parameters were then applied to the rest of the models explored in this work. Regarding the BH accretion parameters that best-fit JWST-AGN observables, these are one to two orders of magnitude greater than previous versions of DELPHI intended to fit pre-JWST AGN observables (Dayal 2019). However, this comparison comes with the caveat that the theoretical framework from this model and in Dayal (2019) are not equal since we introduced the cold gas fractions and star formation efficiencies from SPHINX20, as in Mauerhofer et al. (2025).
The main takeaways from this work are the following:
-
Under our theoretical framework, we find that the fiducial model agrees with the bolometric LF at redshift 6, while it underpredicts the number densities by 0.9 − 3.2 dex at the bright end (≥1045.5 erg s−1) for redshift 7, and overestimates by 0.22 − 1.6 dex the number densities across all luminosities for redshift 5. Indeed, at z = 7, only the ins-sn099 model is capable of reaching such high number densities (≈10−4 cMpc−3 dex−1) in the bright end as a result of its elevated BH accretion. Regarding the BHMF, the fiducial model tends to overpredict JWST estimations at redshift 5 and 6, except for those of Taylor et al. (2025). However, given the selection criteria of these observations, we argue that they do not represent the entirety of the BH population. On one hand, Matthee et al. (2023) and Taylor et al. (2025) only considered a sample of broad Hα sources, while Kokorev et al. (2024) assumed that all of their photometrically selected sample are at the Eddington limit.
-
Including a dynamical timescale impacts the capacity to assemble massive BHs (≥107 M⊙) at early times. After redshift ≈10, the merger rates for the delayed models become more frequent, and BH accretion (related to the spin configuration) becomes the main driver for BH growth. Interestingly, at redshift 5, the rapid BH accretion that the extreme retrograde models yield, virtually erases the impact of adding or not adding a delayed timescale (seen at Fig. 1).
-
We find that the total number of merger rates for redshifts above 5 is 19.61 to 28.06 yr−1 for the delayed and instantaneous model, respectively. These values are within the range found in previous work on heavy seed mergers (Sesana et al. 2007; Klein et al. 2016; Barausse et al. 2020; Dayal et al. 2019; Bonetti et al. 2019; Katz et al. 2020; Liu & Inayoshi 2025). However, we caution that our delayed timescales are conservative and do not comprise the sub-kiloparsec dynamics of interacting BHs. Regarding the merger rates as a function of redshifted mass, we report a distribution that favors larger masses, which peaks around 106 M⊙, and reaches the heaviest masses for models with the most negative spins.
There are still many uncertainties to address in both theory and observations. Regarding our models, we must bear in mind that by choosing conservative timescales for BH mergers, we report optimistic estimates of merger events per year. Indeed, in a model that comprises the full complexity of the sub-kiloparsec evolution between BHs, such as the interactions from local gas (Escala et al. 2005; Dotti et al. 2006), neighboring stars (Sesana & Khan 2015; Vasiliev et al. 2015; Pfister et al. 2019), and gravitational recoil (Haiman 2004; Izquierdo-Villalba et al. 2020), we expect a decrease in the number of BH merger events throughout cosmic time (Barausse et al. 2020; Bonetti et al. 2019). For instance, Dosopoulou & Antonini 2017 finds that low-mass ratio binaries (M2/M1 < 10−3) are expected to sink at longer timescales than one Hubble time. In the case of the fiducial model, the mass ratio of the BH mergers starts with a median value of 0.31 at z ∼ 16, which stochastically decreases to 0.09 at z ∼ 5. Taking into account that the percentage of low-mass ratio binaries fluctuates between 7 × 10⁻⁵% at z ∼ 13 to 15.16% at z ∼ 5, we reiterate our optimism in the results. Certainly, given that we use the instantaneous model with the canonical spin as the fiducial model, we are in a sense minimizing the accretion parameters for BHs to approach JWST observations. On the other hand, incorporating effects from third body interactions (Bonetti et al. 2018), or BH accretion in satellite galaxies that are yet to merge with the main system (which in this work is set to zero), may counteract the slower BH mass assembly from mergers that a more complex model would yield.
Additionally, our models do not account for the fact that BHs may experience different accretion histories depending on their location within the galaxy. In numerical studies, for example, it has been observed that off-nuclear BHs found in low-density environments would experience fewer accretion events in contrast to when nucleated (Bellovary et al. 2021).
From our results, we also acknowledge the need for a more efficient mechanism to quench massive BHs ≥109.5 M⊙, since, in our framework, BHs are allowed to grow as long as gas is available after star formation processes. Indeed, this work limits AGN feedback to a mechanical ejection of gas, with a strength that is fractionally equal for all systems (fwBH = 5 × 10⁻⁴). In turn, we have rare systems (≤10−8 cMpc−3 dex−1) harboring BHs of ≥1010 M⊙ that keep growing due to the large gas reservoir that their halos retain. A careful treatment of BH feedback may also avoid the overestimation we find in the bolometric LF at redshift 5. Additionally, a more diverse impact of BH feedback, would also help reproduce overmassive BHs, such as those reported in Maiolino et al. (2024), Kocevski et al. (2024). We can also try to reach these overmassive BHs by carefully implementing a physically motivated seeding mechanism for direct collapse (DC) BHs. In principle, heavy seeds from the DC channel take place in halos where early fragmentation onto stars must be avoided (Agarwal et al. 2014). This process is possible due to the exposure to Lyman Werner radiation (11.2–13.6 eV) supplemented by first generation stars. This radiation photodissociates molecular hydrogen (H2) and creates atomic cooling halos (ACHs), which are the birth sites for DCBHs. A heavy seed formed by the DC channel may be characterized by a slower assembly of their stellar component, which can explain these overmassive BH to stellar mass sources (Visbal & Haiman 2018), compared to local relations. However, the seeding mechanism for heavy seeds from the DC channel reports extremely low number densities across redshifts (≈10−2.88 − 10−9.2 cMpc−3), too low to reproduce JWST observations in this work (10−1.26 − 10−4.72 cMpc−3). Nonetheless, we must take into account how representative these overmassive BHs are to the underlying population, and whether the majority appear overmassive due to selection biases introduced from JWST instruments (Li et al. 2025).
Finally, for a more accurate depiction of BH population through cosmic time, in future work we must also address the spin evolution as a function of their accretion and merger history. This work is now limited to bracketing the maximal and minimal growth of BHs given the two extreme spin scenarios (a = ±0.99).
Regarding observations, there is an ongoing debate on the true nature of LRDs sources, namely, whether they are compact starburst galaxies (Pérez-González et al. 2024), dust-obscured AGNs (Matthee et al. 2023; Greene et al. 2023; Kokorev et al. 2024) or a mixture of both (Rinaldi et al. 2025). Indeed, studies based on photometrically selected LRDs have found that SED fitting using Quasar or galaxy only templates can show a good fit to their data (Akins et al. 2025a; Kokorev et al. 2024). Photometric selection of sources may not only be prone to misidentification of their nature, but can also result in an interloper at lower redshifts (Salvato et al. 2018). Regarding a plausible mixed nature, Rinaldi et al. (2025) found that 30% of their photometrically selected sample of LRDs show non-compact morphology in the UV rest-frame, where half of these show two distinctive sources while the other showcases asymmetries suggestive of ongoing or recent merger activity. When spectroscopy is available and a broad Balmer emission line is detected, studies can estimate the BH mass using local relations (z < 0.3) derived from reverberation mapping (Bentz et al. 2013). It is debatable whether this relation stands for these high-z sources (z > 4), since it is unknown whether the broad-line region is virialized when AGNs accrete close to or above the Eddington limit (Lupi et al. 2024; King 2024). Unfortunately, studies of reverberation mapping for high-z sources are incredibly challenging due to the (1+z) lag increase, while other tracers for BH mass are minimal. Recently, Abuter et al. (2024) compared the dynamical measurement of the BH mass from bright quasars (log(LBol)=47.2 − 47.9 erg s−1) at z ∼ 2, to BH single-epoch mass estimates from different broadened emission lines (CIV, Hβ, and Hα), finding a mass overestimation of 0.43–1.2 dex compared to the dynamical method. There is a possibility that BH masses for high-z AGNs may be overestimated from the single-epoch method. An AGN-only solution for LRDs is also questioned due to their mostly non-detected X-ray counterparts (Ananna et al. 2024; Maiolino et al. 2025). However, there are theoretical efforts that explain weak X-ray emission as being a consequence of low spinning (a ∼ 0) and mildly super Eddington accretion 1.4 < fEdd < 4, which can lead to strong winds that artificially broaden the broad line regions (boosting estimations for BH masses), as well as large covering fractions (Pacucci & Narayan 2024). Along this line, Taylor et al. (2025) found that stacking the spectra of sources with detected broad Hα by those that enter the LRD criteria compared to those that do not, systematically report larger FWHMs (2188 km s−1) compared to the latter (1768
 km s−1). Alternatively, Inayoshi & Ichikawa (2024) suggest that BHs from LRDs may be maximally prograde spinning, and hence the elevated radiative efficiency (ϵ = 0.42) would imply smaller BH masses. Given that the majority of the observables we aim to reproduce fall under the LRD criteria, showcasing an SED (Akins et al. 2025a) that differs greatly from a typical AGN (Shen et al. 2020), a more detailed analysis for the UVLF will be shown in a follow-up paper. Finally, it is important to acknowledge that the estimated number densities for JWST-AGN could be biased due to cosmic variance. The effect of cosmic variance worsens with increasing redshift and decreasing survey area. For high redshift surveys (z > 4) Ucci et al. (2021) found that CV is negligible when considering a survey that covers an area ≥1000 arcmin2, which is not satisfied by any of the works that have reported number densities for JWST-AGNs.
Data availability
The calibrated observables for AGNs and galaxies, as well as the merger rate events as a function of redshift and redshifted BH mass for all models explored, can be found here.
Acknowledgments
We thank the anonymous referee for their suggestions on improving the presentation of this work. P. Cáceres-Burgos acknowledges the support from the TITANS nucleo milenio NCN2023_002. P. Lira acknowledges the support from the National Laboratory of High Performance Computing (NLHPC) Chile facilities, as well as the support from the FONDECYT 1201748. P. Dayal warmly acknowledges support from an NSERC discovery grant (RGPIN-2025-06182).
References
- Abbott, R., Abbott, T., Abraham, S., et al. 2020, Phys. Rev. Lett., 125, 17 [Google Scholar]
- Abbott, R., Abbott, T. D., Abraham, S., et al. 2021, Phys. Rev. X, 11, 21053 [Google Scholar]
- Abbott, R., Abbott, T. D., Acernese, F., et al. 2023, Phys. Rev. X, 13, 11048 [Google Scholar]
- Abbott, R., Abbott, T. D., Acernese, F., et al. 2024, Phys. Rev. D, 109, 45 [Google Scholar]
- Abuter, R., Allouche, F., Amorim, A., et al. 2024, Nature, 627, 281 [NASA ADS] [CrossRef] [Google Scholar]
- Adams, N. J., Conselice, C. J., Ferreira, L., et al. 2022, MNRAS, 518, 4755 [NASA ADS] [CrossRef] [Google Scholar]
- Adams, N. J., Conselice, C. J., Austin, D., et al. 2024, ApJ, 965, 21 [Google Scholar]
- Agarwal, B., Vecchia, C. D., Johnson, J. L., Khochfar, S., & Paardekooper, J. P. 2014, MNRAS, 443, 648 [Google Scholar]
- Akins, H. B., Casey, C. M., Lambrides, E., et al. 2025a, ApJ, 991, 37 [Google Scholar]
- Akins, H. B., Casey, C. M., Berg, D. A., et al. 2025b, ApJ, 980, L29 [Google Scholar]
- Almeida, I., Nemmen, R., Wong, K. W., Wu, Q., & Irwin, J. A. 2018, MNRAS, 475, 5398 [Google Scholar]
- Amaro-Seoane, P., Andrews, J., Arca Sedda, M., et al. 2023, Liv. Rev. Rel., 26, 2 [NASA ADS] [CrossRef] [Google Scholar]
- Ananna, T. T., Bogdán, k., Kovács, O. E., Natarajan, P., & Hickox, R. C. 2024, ApJ, 969, L18 [NASA ADS] [CrossRef] [Google Scholar]
- Arun, K. G., Babak, S., Berti, E., et al. 2009, Class. Quant. Grav., 26, 094027 [NASA ADS] [CrossRef] [Google Scholar]
- Asplund, M., Grevesse, N., & Sauval, A. J. 2005, in Cosmic Abundances as Records of Stellar Evolution and Nucleosynthesis, eds. I. I. I. Barnes Thomas G., & F. N. Bash, ASP Conf. Ser., 336, 25 [NASA ADS] [Google Scholar]
- Atek, H., Richard, J., Kneib, J.-P., et al. 2015, ApJ, 800, 18 [Google Scholar]
- Atek, H., Richard, J., Kneib, J.-P., & Schaerer, D. 2018, MNRAS, 479, 5184 [Google Scholar]
- Bañados, E., Venemans, B. P., Decarli, R., et al. 2016, ApJS, 227, 11 [Google Scholar]
- Barausse, E., Dvorkin, I., Tremmel, M., Volonteri, M., & Bonetti, M. 2020, ApJ, 904, 16 [NASA ADS] [CrossRef] [Google Scholar]
- Bardeen, J. M., Pressj, W. H., & Teukolsky, S. A. 1972, ApJ, 178, 347 [NASA ADS] [CrossRef] [Google Scholar]
- Begelman, M. C., Blandford, R. D., & Rees, M. J. 1980, Nature, 287, 307 [Google Scholar]
- Begelman, M. C., Volonteri, M., & Rees, M. J. 2006, MNRAS, 370, 289 [NASA ADS] [CrossRef] [Google Scholar]
- Behroozi, P., Wechsler, R. H., Hearin, A. P., & Conroy, C. 2019, MNRAS, 488, 3143 [NASA ADS] [CrossRef] [Google Scholar]
- Bellovary, J. M., Hayoune, S., Chafla, K., et al. 2021, MNRAS, 505, 5129 [NASA ADS] [CrossRef] [Google Scholar]
- Bentz, M. C., Denney, K. D., Grier, C. J., et al. 2013, ApJ, 767, 149 [Google Scholar]
- Bhatawdekar, R., Conselice, C. J., Margalef-Bentabol, B., & Duncan, K. 2019, MNRAS, 486, 3805 [NASA ADS] [CrossRef] [Google Scholar]
- Biava, N., Colpi, M., Capelo, P. R., et al. 2019, MNRAS, 487, 4985 [Google Scholar]
- Bogdan, A., Goulding, A., Natarajan, P., et al. 2023, Nat. Astron., 8, 126 [Google Scholar]
- Bohm, G., & Zech, G. 2013, Nucl. Instrum. Methods Phys. Res. A, 748, 1 [Google Scholar]
- Bonetti, M., Haardt, F., Sesana, A., & Barausse, E. 2018, MNRAS, 477, 3910 [Google Scholar]
- Bonetti, M., Sesana, A., Haardt, F., Barausse, E., & Colpi, M. 2019, MNRAS, 486, 4044 [NASA ADS] [CrossRef] [Google Scholar]
- Bortolas, E., Franchini, A., Bonetti, M., & Sesana, A. 2021, ApJ, 918, L15 [NASA ADS] [CrossRef] [Google Scholar]
- Bouwens, R. J., Oesch, P. A., Stefanon, M., et al. 2021, AJ, 162, 47 [NASA ADS] [CrossRef] [Google Scholar]
- Bouwens, R. J., Illingworth, G. D., Ellis, R. S., Oesch, P. A., & Stefanon, M. 2022, ApJ, 940, 55 [NASA ADS] [CrossRef] [Google Scholar]
- Bouwens, R. J., Stefanon, M., Brammer, G., et al. 2023, MNRAS, 523, 1036 [NASA ADS] [CrossRef] [Google Scholar]
- Bower, R. G., Schaye, J., Frenk, C. S., et al. 2017, MNRAS, 465, 32 [NASA ADS] [CrossRef] [Google Scholar]
- Bowler, R. A. A., Dunlop, J. S., McLure, R. J., & McLeod, D. J. 2017, MNRAS, 466, 3612 [NASA ADS] [CrossRef] [Google Scholar]
- Casey, C. M., Akins, H. B., Shuntov, M., et al. 2024, ApJ, 965, 22 [CrossRef] [Google Scholar]
- Chen, N., Ni, Y., Tremmel, M., et al. 2022, MNRAS, 510, 531 [Google Scholar]
- Chiaberge, M., Gilli, R., Macchetto, F. D., & Sparks, W. B. 2006, ApJ, 651, 728 [Google Scholar]
- Cole, S., Lacey, C. G., Baugh, C. M., & Frenk, C. S. 2000, MNRAS, 319, 168 [Google Scholar]
- Colpi, M. 2014, Springer Nat., 183, 189 [Google Scholar]
- Dayal, P. 2019, Proc. Int. Astron. Union, 15, 43 [Google Scholar]
- Dayal, P., Hirashita, H., & Ferrara, A. 2010, MNRAS, 403, 620 [NASA ADS] [CrossRef] [Google Scholar]
- Dayal, P., Ferrara, A., Dunlop, J. S., & Pacucci, F. 2014, MNRAS, 445, 2545 [CrossRef] [Google Scholar]
- Dayal, P., Rossi, E. M., Shiralilou, B., et al. 2019, MNRAS, 486, 2336 [Google Scholar]
- Dayal, P., Ferrara, A., Sommovigo, L., et al. 2022, MNRAS, 512, 989 [NASA ADS] [CrossRef] [Google Scholar]
- Dayal, P., Volonteri, M., Greene, J. E., et al. 2025, A&A, 697, A211 [NASA ADS] [CrossRef] [EDP Sciences] [Google Scholar]
- Devecchi, B., Volonteri, M., Rossi, E. M., Colpi, M., & Portegies Zwart, S. 2012, MNRAS, 421, 1465 [NASA ADS] [CrossRef] [Google Scholar]
- Di Matteo, T., Ni, Y., Chen, N., et al. 2023, MNRAS, 525, 1479 [Google Scholar]
- Dijkstra, M., Ferrara, A., & Mesinger, A. 2014, MNRAS, 442, 2036 [CrossRef] [Google Scholar]
- Ding, X., Onoue, M., Silverman, J. D., et al. 2023, Nature, 621, 51 [NASA ADS] [CrossRef] [Google Scholar]
- Donnan, C. T., McLeod, D. J., Dunlop, J. S., et al. 2022, MNRAS, 518, 6011 [NASA ADS] [CrossRef] [Google Scholar]
- Donnan, C. T., McLure, R. J., Dunlop, J. S., et al. 2024, MNRAS, 533, 3222 [NASA ADS] [CrossRef] [Google Scholar]
- Dosopoulou, F., & Antonini, F. 2017, ApJ, 840, 31 [Google Scholar]
- Dotti, M., Colpi, M., & Haardt, F. 2006, MNRAS, 367, 103 [Google Scholar]
- Duncan, K., Conselice, C. J., Mortlock, A., et al. 2014, MNRAS, 444, 2960 [Google Scholar]
- Duras, F., Bongiorno, A., Ricci, F., et al. 2020, A&A, 636, A73 [NASA ADS] [CrossRef] [EDP Sciences] [Google Scholar]
- EPTA Collaboration and InPTA Collaboration (Antoniadis, J., et al.) 2024, A&A, 685, A94 [NASA ADS] [CrossRef] [EDP Sciences] [Google Scholar]
- Escala, A., Larson, R. B., Coppi, P. S., & Mardones, D. 2005, ApJ, 630, 152 [Google Scholar]
- Esin, A. A., McClintock, J. E., & Narayan, R. 1997, ApJ, 489, 865 [NASA ADS] [CrossRef] [Google Scholar]
- Fan, X., Strauss, M. A., Becker, R. H., et al. 2006, AJ, 132, 117 [NASA ADS] [CrossRef] [Google Scholar]
- Finkelstein, S. L., Leung, G. C. K., Bagley, M. B., et al. 2024, ApJ, 969, L2 [NASA ADS] [CrossRef] [Google Scholar]
- Fudamoto, Y., Smit, R., Bowler, R. A. A., et al. 2022, ApJ, 934, 144 [NASA ADS] [CrossRef] [Google Scholar]
- Furtak, L. J., Labbé, I., Zitrin, A., et al. 2024, Nature, 628, 57 [NASA ADS] [CrossRef] [Google Scholar]
- Giallongo, E., Grazian, A., Fiore, F., et al. 2015, A&A, 578, A83 [NASA ADS] [CrossRef] [EDP Sciences] [Google Scholar]
- Glikman, E., Helfand, D. J., & White, R. L. 2006, ApJ, 640, 579 [NASA ADS] [CrossRef] [Google Scholar]
- Greene, J. E., & Ho, L. C. 2005, ApJ, 630, 122 [NASA ADS] [CrossRef] [Google Scholar]
- Greene, J. E., Labbe, I., Goulding, A. D., et al. 2023, ApJ, 23, 333 [Google Scholar]
- Habouzit, M., Volonteri, M., Latif, M., Dubois, Y., & Peirani, S. 2016, MNRAS, 463, 529 [NASA ADS] [CrossRef] [Google Scholar]
- Haiman, Z. 2004, ApJ, 613, 36 [Google Scholar]
- Haiman, Z., Kocsis, B., & Menou, K. 2009, ApJ, 700, 1952 [CrossRef] [Google Scholar]
- Harikane, Y., Ono, Y., Ouchi, M., et al. 2022, ApJS, 259, 20 [NASA ADS] [CrossRef] [Google Scholar]
- Harikane, Y., Ouchi, M., Oguri, M., et al. 2023a, ApJS, 265, 5 [NASA ADS] [CrossRef] [Google Scholar]
- Harikane, Y., Zhang, Y., Nakajima, K., et al. 2023b, ApJ, 959, 39 [NASA ADS] [CrossRef] [Google Scholar]
- Harikane, Y., Nakajima, K., Ouchi, M., et al. 2024, ApJ, 960, 56 [NASA ADS] [CrossRef] [Google Scholar]
- Harvey, T., Conselice, C. J., Adams, N. J., et al. 2025, ApJ, 978, 36 [NASA ADS] [CrossRef] [Google Scholar]
- Inayoshi, K., & Ichikawa, K. 2024, ApJL, 973, L49 [Google Scholar]
- Izquierdo-Villalba, D., Bonoli, S., Dotti, M., et al. 2020, MNRAS, 495, 4681 [NASA ADS] [CrossRef] [Google Scholar]
- Kaspi, S., Smith, P. S., Netzer, H., et al. 2000, ApJ, 533, 631 [Google Scholar]
- Katz, M. L., Kelley, L. Z., Dosopoulou, F., et al. 2020, MNRAS, 491, 2301 [NASA ADS] [Google Scholar]
- Kelley, L. Z., Blecha, L., & Hernquist, L. 2017, MNRAS, 464, 3131 [NASA ADS] [CrossRef] [Google Scholar]
- King, A. 2024, MNRAS, 531, 550 [NASA ADS] [CrossRef] [Google Scholar]
- Klein, A., Barausse, E., Sesana, A., et al. 2016, Phys. Rev. D, 93, 024003 [NASA ADS] [CrossRef] [Google Scholar]
- Kobayashi, C., Karakas, A. I., & Lugaro, M. 2020, ApJ, 900, 179 [Google Scholar]
- Kocevski, D. D., Onoue, M., Inayoshi, K., et al. 2023, ApJ, 954, L4 [NASA ADS] [CrossRef] [Google Scholar]
- Kocevski, D. D., Finkelstein, S. L., Barro, G., et al. 2024, arXiv e-prints [arXiv:2404.03576] [Google Scholar]
- Kokorev, V., Fujimoto, S., Labbe, I., et al. 2023, ApJ, 957, L7 [NASA ADS] [CrossRef] [Google Scholar]
- Kokorev, V., Caputi, K. I., Greene, J. E., et al. 2024, ApJ, 968, 38 [NASA ADS] [CrossRef] [Google Scholar]
- Koushiappas, S. M., Bullock, J. S., & Dekel, A. 2004, MNRAS, 354, 292 [CrossRef] [Google Scholar]
- Kovács, O. E., Bogdán, K., Natarajan, P., et al. 2024, ApJ, 965, L21 [CrossRef] [Google Scholar]
- Kroupa, P. 2001, MNRAS, 322, 231 [NASA ADS] [CrossRef] [Google Scholar]
- Lacey, C., & Cole, S. 1993, MNRAS, 62, 627 [Google Scholar]
- Larson, R. L., Finkelstein, S. L., Kocevski, D. D., et al. 2023, ApJ, 953, L29 [NASA ADS] [CrossRef] [Google Scholar]
- Latif, M., & Schleicher, D. 2019, Formation of the First Black Holes (WORLD SCIENTIFIC), 20 [Google Scholar]
- Leitherer, C., Schaerer, D., Goldader, J. D., et al. 1999, ApJS, 123, 3 [Google Scholar]
- Lesniewska, A., & Michałowski, M. J. 2019, A&A, 624, L13 [NASA ADS] [CrossRef] [EDP Sciences] [Google Scholar]
- Leung, G. C. K., Bagley, M. B., Finkelstein, S. L., et al. 2023, ApJ, 954, L46 [NASA ADS] [CrossRef] [Google Scholar]
- Li, J., Silverman, J. D., Shen, Y., et al. 2025, ApJ, 981, 19 [Google Scholar]
- Lin, X., Wang, F., Fan, X., et al. 2024, ApJ, 974, 147 [NASA ADS] [CrossRef] [Google Scholar]
- Liu, H., & Inayoshi, K. 2025, Phys. Rev. D, 111, 043012 [Google Scholar]
- Lupi, A., Haardt, F., Dotti, M., et al. 2016, MNRAS, 456, 2993 [NASA ADS] [CrossRef] [Google Scholar]
- Lupi, A., Trinca, A., Volonteri, M., Dotti, M., & Mazzucchelli, C. 2024, A&A, 689, A128 [NASA ADS] [CrossRef] [EDP Sciences] [Google Scholar]
- Lusso, E., Comastri, A., Simmons, B. D., et al. 2012, MNRAS, 425, 623 [Google Scholar]
- Maiolino, R., & Rieke, G. H. 1995, ApJ, 454, 95 [Google Scholar]
- Maiolino, R., Scholtz, J., Curtis-Lake, E., et al. 2024, A&A, 691, A145 [NASA ADS] [CrossRef] [EDP Sciences] [Google Scholar]
- Maiolino, R., Risaliti, G., Signorini, M., et al. 2025, MNRAS, 538, 1921 [Google Scholar]
- Matthee, J., Naidu, R. P., Brammer, G., et al. 2023, ApJ, 936, 129 [Google Scholar]
- Mauerhofer, V., & Dayal, P. 2023, MNRAS, 526, 2196 [NASA ADS] [CrossRef] [Google Scholar]
- Mauerhofer, V., Dayal, P., Haehnelt, M. G., et al. 2025, A&A, 696, A157 [NASA ADS] [CrossRef] [EDP Sciences] [Google Scholar]
- McGreer, I. D., Jiang, L., Fan, X., et al. 2013, ApJ, 768, 105 [NASA ADS] [CrossRef] [Google Scholar]
- McLeod, D. J., Donnan, C. T., McLure, R. J., et al. 2024, MNRAS, 527, 5004 [Google Scholar]
- Meynet, G., Maeder, A., Schaller, G., Schaerer, D., & Charbonnel, C. 1994, A&AS, 103, 97 [Google Scholar]
- Naidu, R. P., Oesch, P. A., Dokkum, P. v., et al. 2022, ApJ, 940, L14 [NASA ADS] [CrossRef] [Google Scholar]
- Narayan, R., & Yi, I. 1994, ApJ, 428, L13 [Google Scholar]
- Natarajan, P., Pacucci, F., Ricarte, A., et al. 2024, ApJ, 960, L1 [NASA ADS] [CrossRef] [Google Scholar]
- Navarro-Carrera, R., Rinaldi, P., Caputi, K. I., et al. 2024, ApJ, 961, 207 [CrossRef] [Google Scholar]
- Niida, M., Nagao, T., Ikeda, H., et al. 2020, ApJ, 904, 89 [NASA ADS] [CrossRef] [Google Scholar]
- Nozawa, T., Kozasa, T., Umeda, H., Maeda, K., & Nomoto, K. 2003, ApJ, 598, 785 [NASA ADS] [CrossRef] [Google Scholar]
- Oesch, P. A., Bouwens, R. J., Illingworth, G. D., Labbe, I., & Stefanon, M. 2018, ApJ, 855, 105 [NASA ADS] [CrossRef] [Google Scholar]
- Oke, J. B., & Gunn, J. E. 1983, ApJ, 266, 713 [NASA ADS] [CrossRef] [Google Scholar]
- Pacucci, F., & Narayan, R. 2024, ApJ, 976, 96 [NASA ADS] [CrossRef] [Google Scholar]
- Pacucci, F., Nguyen, B., Carniani, S., Maiolino, R., & Fan, X. 2023, ApJ, 957, L3 [CrossRef] [Google Scholar]
- Parkinson, H., Cole, S., & Helly, J. 2007, MNRAS, 383, 557 [NASA ADS] [CrossRef] [Google Scholar]
- Pensabene, A., Carniani, S., Perna, M., et al. 2020, A&A, 637, A84 [NASA ADS] [CrossRef] [EDP Sciences] [Google Scholar]
- Pérez-González, P. G., Costantin, L., Langeroodi, D., et al. 2023, ApJ, 951, L1 [CrossRef] [Google Scholar]
- Pérez-González, P. G., Barro, G., Rieke, G. H., et al. 2024, ApJ, 968, 4 [CrossRef] [Google Scholar]
- Pfister, H., Volonteri, M., Dubois, Y., Dotti, M., & Colpi, M. 2019, MNRAS, 486, 101 [Google Scholar]
- Piana, O., Dayal, P., Volonteri, M., & Choudhury, T. R. 2020, MNRAS, 500, 2146 [Google Scholar]
- Piana, O., Dayal, P., & Choudhury, T. R. 2021, MNRAS, 510, 5561 [Google Scholar]
- Planck Collaboration VI. 2020, A&A, 641, A6 [NASA ADS] [CrossRef] [EDP Sciences] [Google Scholar]
- Punturo, M., Abernathy, M., Acernese, F., et al. 2010, Class. Quant. Grav., 27, 194002 [Google Scholar]
- Regan, J. A., Downes, T. P., Volonteri, M., et al. 2019, MNRAS, 486, 3892 [CrossRef] [Google Scholar]
- Reines, A. E., & Volonteri, M. 2015, ApJ, 813, 82 [NASA ADS] [CrossRef] [Google Scholar]
- Ricarte, A., & Natarajan, P. 2018, MNRAS, 481, 3278 [NASA ADS] [CrossRef] [Google Scholar]
- Richards, G. T., Lacy, M., Storrie-Lombardi, L. J., et al. 2006, ApJS, 166, 470 [Google Scholar]
- Rinaldi, P., Bonaventura, N., Rieke, G. H., et al. 2025, ApJ, 992, 71 [Google Scholar]
- Robertson, B., Johnson, B. D., Tacchella, S., et al. 2024, ApJ, 970, 27 [Google Scholar]
- Rosdahl, J., Blaizot, J., Katz, H., et al. 2022, MNRAS, 515, 2386 [CrossRef] [Google Scholar]
- Salcido, J., Bower, R. G., Theuns, T., et al. 2016, MNRAS, 463, 870 [NASA ADS] [CrossRef] [Google Scholar]
- Salvato, M., Ilbert, O., & Hoyle, B. 2018, Nat. Astron., 3, 212 [CrossRef] [Google Scholar]
- Sesana, A., & Khan, F. M. 2015, MNRAS, 454, L66 [Google Scholar]
- Sesana, A., Volonteri, M., & Haardt, F. 2007, MNRAS, 377, 1711 [NASA ADS] [CrossRef] [Google Scholar]
- Sesana, A., Gair, J., Berti, E., & Volonteri, M. 2011, Phys. Rev. D, 83, 044036 [NASA ADS] [CrossRef] [Google Scholar]
- Shankar, F., Weinberg, D. H., & Miralda-Escudé, J. 2009, ApJ, 690, 20 [NASA ADS] [CrossRef] [Google Scholar]
- Shen, X., Hopkins, P. F., Faucher-Giguère, C.-A., et al. 2020, MNRAS, 495, 3252 [Google Scholar]
- Sheth, R. K., & Tormen, G. 1999, MNRAS, 308, 119 [Google Scholar]
- Somerville, R. S., Yung, L. Y. A., Lancaster, L., et al. 2025, MNRAS, 544, 3774 [Google Scholar]
- Song, M., Finkelstein, S. L., Ashby, M. L. N., et al. 2016, ApJ, 825, 5 [NASA ADS] [CrossRef] [Google Scholar]
- Stefanon, M., Bouwens, R. J., Labbé, I., et al. 2021, ApJ, 922, 29 [NASA ADS] [CrossRef] [Google Scholar]
- Suh, H., Civano, F., Trakhtenbrot, B., et al. 2020, ApJ, 889, 32 [NASA ADS] [CrossRef] [Google Scholar]
- Taylor, A. J., Finkelstein, S. L., Kocevski, D. D., et al. 2025, ApJ, 986, 165 [Google Scholar]
- Todini, P., & Ferrara, A. 2001, MNRAS, 325, 726 [NASA ADS] [CrossRef] [Google Scholar]
- Tremmel, M., Governato, F., Volonteri, M., Quinn, T. R., & Pontzen, A. 2018, MNRAS, 475, 4967 [Google Scholar]
- Tripodi, R., Martis, N., Markov, V., et al. 2025, Nat. Commun., 16, 9830 [Google Scholar]
- Ucci, G., Dayal, P., Hutter, A., et al. 2021, MNRAS, 506, 202 [CrossRef] [Google Scholar]
- Ueda, Y., Akiyama, M., Hasinger, G., Miyaji, T., & Watson, M. G. 2014, ApJ, 786, 104 [Google Scholar]
- Valiante, R., Schneider, R., Graziani, L., & Zappacosta, L. 2018, MNRAS, 474, 3825 [NASA ADS] [CrossRef] [Google Scholar]
- Vanden Berk, D. E., Richards, G. T., Bauer, A., et al. 2001, AJ, 122, 549 [Google Scholar]
- Vasiliev, E., Antonini, F., & Merritt, D. 2015, ApJ, 810, 49 [Google Scholar]
- Visbal, E., & Haiman, Z. 2018, ApJ, 865, L9 [NASA ADS] [CrossRef] [Google Scholar]
- Volonteri, M., Lodato, G., & Natarajan, P. 2008, MNRAS, 383, 1079 [Google Scholar]
- Volonteri, M., Pfister, H., Beckmann, R. S., et al. 2020, MNRAS, 498, 2219 [Google Scholar]
- Whitler, L., Stark, D. P., Topping, M. W., et al. 2025, ApJ, 992, 63 [Google Scholar]
- Willott, C. J., Albert, L., Arzoumanian, D., et al. 2010a, AJ, 140, 546 [NASA ADS] [CrossRef] [Google Scholar]
- Willott, C. J., Delorme, P., Reylé, C., et al. 2010b, AJ, 139, 906 [Google Scholar]
- Willott, C. J., Desprez, G., Asada, Y., et al. 2024, ApJ, 966, 24 [Google Scholar]
- Younes, G., Porquet, D., Sabra, B., Reeves, J. N., & Grosso, N. 2012, A&A, 539, A104 [NASA ADS] [CrossRef] [EDP Sciences] [Google Scholar]
- Yuan, F., & Narayan, R. 2014, ARA&A, 52, 529 [NASA ADS] [CrossRef] [Google Scholar]
- Yue, M., Eilers, A.-C., Simcoe, R. A., et al. 2024, ApJ, 966, 176 [NASA ADS] [CrossRef] [Google Scholar]
For most cases, our selected model agree with the lower and upper limits from observations.
If we were to use the former theoretical framework of DELPHI we find that the accretion parameters must be ≈2–3 orders of magnitude higher.
Appendix A: Number densities of BH seeds
In this work, we seed heavy BHs on all starting metal-free halos from our DM merger tree until redshift 12.8. Due to this decision is that the number density is subject to the resolution of the DM merger tree, and spans from 10−4.72 − 10−1.26cMpc−3 between redshifts 26 to 13. In Fig A.1 we show our number densities (orange circles) compared to other numerical and semi-analytical simulations for light and heavy BH seeds. Shown as squares and diamonds are the analytical and numerical predictions for physically motivated heavy BH seeds formed via the Direct Collapse method (Dijkstra et al. 2014; Habouzit et al. 2016; Dayal et al. 2019). In squares (diamonds) are the predictions from assuming a critical LW radiation of 300(30)J21. Using semi-analytical simulations Dijkstra et al. (2014) (shaded in gray) focuses on finding the abundance of halos that may form a DCBH, which satisfies (i) a virial halo temperature (Tvirial) above 104K, (ii) low gas metallicity of Z < Zcrit = 10−5 ± 1 Z⊙ to prevent premature fragmentation, and (iii) a LW exposure above a given threshold, able to photodissociate molecular hydrogen. Additionally, they explore the impact of metal pollution via galactic outflows (SNe and young stellar winds), as well as “genetic” enrichment from galaxy progenitors. We show their predictions from their fiducial models. Similarly, in hydrodynamical simulations, Habouzit et al. (2016) (empty diamonds) searches for eligible regions where DCBHs can form, requiring the criteria of (i),(ii) and (iii) and exploring different strengths of SNe feedback in three sets of numerical boxes with side lengths of 1, 10, and 142 cMpc. The data points we show for the latter work correspond to the number densities of halos in the 10cMpc with a prescription of weak SNe feedback. Similarly, the D19 (shaded orange) seeds heavy BHs in halos that satisfy (i) Tvirial ≥ 104K, (ii) no metals Z = 0, and (iii) the > 0.5 probability of the halo being radiated by a LW threshold above 30 or 300 Jcrit. They also seed light BHs (150 M⊙) in metal-free starting halos until redshift 13 (orange stars), a prescription that aligns with the one used in this work for heavy seeds. However, we note that the number density from both our prescriptions of light seeds in D19 and our heavy seeds do not coincide as they should. This is because the HMF they use to calibrate they DM merger tree is a factor 2.6 greater than the one used in this work. Finally, we show the number density predictions from Devecchi et al. (2012) for PopIII BHs (empty stars) and BHs from the runaway collisions of Nuclear stellar clusters (empty triangles). These number densities are calculated using a semi-analytical prescription, that accounts for the metal enrichment from first generation stars, and the subsequent transition toward PopII and PopI stars, while for the formation of BHs via NSCs are tracked using the Toomre parameter of instability in disk-like structure. We retrieve the data points for NSCs assuming an average mass of 700 M⊙ as in Latif & Schleicher (2019). By comparing against these different works, we note right away how the physically motivated number densities predictions from BHs via the DC mechanism are too rare in comparison with this work. Indeed, to achieve similar observables as reported by JWST-AGNs, it is needed a mechanism of heavy seed formation that is much more abundant than the DC model. Nonetheless, our required number densities have comparable values as those reported by the runaway collisions of NSCs, however, the mass range that the latter method provides ranges between 102 − 103 M⊙, barely overlapping with the mass range from our initial BH mass prescription (103 − 105 M⊙). Indeed, under the assumption that all reported JWST-AGN observations are accurate, and that these come from heavy seeds, it will be necessary to explore theoretical models that can allow for these to be more common.
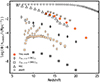 |
Fig. A.1. Number densities for different BH seeds by comoving megaparsec. The orange circles are the case for seeding all pristine halos at redshift above ≳ 13. The diamond shaped markers correspond to the DCBH scenario assuming the minimum Lyman-Werner radiation scenario, in white are Habouzit et al. (2016) and on gray Dijkstra et al. (2014), the squares are the maximal Lyman-Werner threshold form Dijkstra et al. (2014), the white stars are the semi-analytical calculation of NSC BH seed from Devecchi et al. (2012) assuming an average mass of 700 M⊙. |
Appendix B: Choosing the best-fitting parameters
In this section, we present the references used (Table B.1) to determine the optimal parameters of our fiducial model (see Section 3.1), the values explored in our analysis, as well as the UVLF (Fig. B.3) and SMF (Fig. B.2) for our galaxy observables.
We note that for the UVLF of Lyman break galaxies (LBGs) (Fig B.3), the fiducial model agrees with observations for most redshifts except for those above z≥11, and at z∼5. At z∼5, we see that galaxies with MUV< -20.5 underestimate the number densities found in observations by approximately 0.4 dex. We argue that this comes as a result of the elevated BH accretion and feedback found in massive galaxies, which compete with the gas mass budget for star formation. Regarding our predictions for the UVLF at z≥11, we find a systematic underestimation of the number densities for bright galaxies with MUV≲-18. In order to boost galaxy luminosities, previous work from Mauerhofer et al. 2025 explored that by modifying the initial mass function as a function of redshift and metallicity, or the star formation efficiencies as a function of redshift, can result in a better fit to these extreme redshift datasets.
Grid of (free) parameters explored in this work
References used for the chi square calculation of each observable.
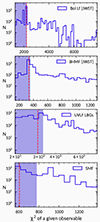 |
Fig. B.1. Chi square histogram from the parameter exploration for a given observable. From top to bottom: JWST bolometric LF, JWST BHMF, UVLF LBGs, and SMF. For each, we show in blue the models that are within the 50th percentile, and as a red vertical dashed line the model that satisfies our criteria of best overall fit |
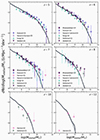 |
Fig. B.2. Stellar mass function of the fiducial model for redshifts 5, 6, 7, 8, 10 and 12. Observational data comes from Duncan et al. 2014; Song et al. 2016; Bhatawdekar et al. 2019; Stefanon et al. 2021; Navarro-Carrera et al. 2024; Harvey et al. 2025. |
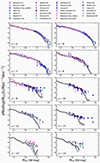 |
Fig. B.3. UV luminosity function of the fiducial model for redshifts 5 to 14. Observational data come from Bouwens et al. (2022, 2021, 2023), Harikane et al. (2022, 2023a, 2024), Pérez-González et al. (2023), Atek et al. (2015, 2018), Oesch et al. (2018), Adams et al. (2022), Donnan et al. (2022, 2024), Bowler et al. (2017), Willott et al. (2024), Naidu et al. (2022), McLeod et al. (2024), Robertson et al. (2024), Whitler et al. (2025), Leung et al. (2023), Adams et al. (2024), Casey et al. (2024). |
All Tables
All Figures
|
Fig. 1. Bolometric luminosity functions for AGNs for redshifts 5, 6, 7 and 10. The instantaneous models are shown as solid lines, while the delayed models are shown as dashed lines. The shaded areas for each model correspond to their Poisson errors. The fiducial model (ins) and delayed (DEL) are shown in black, the extreme retrograde are shown in pink and the extreme prograde in blue (del-sp099). Observations pre-JWST are represented by the fits from Shen et al. (2020) (green dash-dot lines). JWST results are from Greene et al. (2023), Kokorev et al. (2024), Matthee et al. (2023), Kovács et al. (2024), Akins et al. (2025a), Lin et al. (2024). |
| In the text | |
|
Fig. 2. Black hole mass functions at redshifts 5 and 6 for the fiducial (solid black lines), DEL (dashed black lines), ins-sn099 (solid pink lines), and del-sp099 (dashed blue lines). The thin lines represent all BHs, while thick lines show BHs with LBol ≥ 1044 erg s−1 and |
| In the text | |
|
Fig. 3. Stellar to BH mass relation for the fiducial (shaded contours) DEL (line contours), ins-sn099 and del-sp099 models at redshifts 5, 7 and 10. Here, we present the relation as contours from a smoothed 2D histogram, weighted by their associated number density. In all panels, we show the scaling relations for local Elliptical and Spheroidals (solid black line) (Reines & Volonteri 2015), high redshift galaxies (z ∼ 2.5) (Suh et al. 2020) (dash-dotted black line), and the relation for high-redshift (z = 4–7) AGNs using only JWST sources (Pacucci et al. 2023) (dashed black lines). Observations pre-JWST come from works of Pensabene et al. (2020), and the latest results from JWST from Maiolino et al. (2024), Harikane et al. (2023b), Yue et al. (2024), Bogdan et al. (2023), Rinaldi et al. (2025), Tripodi et al. (2025), Larson et al. (2023), Kokorev et al. (2023), Akins et al. (2025b) and Kovács et al. (2024). |
| In the text | |
|
Fig. 4. Raw merger rates as a function of redshift. In the upper panel, we show the cumulative merger events for BHs per year as a function of redshift, and in the bottom are the merger rates at a given redshift bin. Instantaneous models are shown as solid lines, while delayed models are indicated with dashed lines. |
| In the text | |
|
Fig. 5. Merger rate events per year as a function of redshifted merged BH mass for all of our models. Dashed lines correspond to the delayed models (DEL, del-sp099, del-sn099), and the solid lines represent the instantaneous (fid, ins-sp099, ins-sn099). |
| In the text | |
|
Fig. A.1. Number densities for different BH seeds by comoving megaparsec. The orange circles are the case for seeding all pristine halos at redshift above ≳ 13. The diamond shaped markers correspond to the DCBH scenario assuming the minimum Lyman-Werner radiation scenario, in white are Habouzit et al. (2016) and on gray Dijkstra et al. (2014), the squares are the maximal Lyman-Werner threshold form Dijkstra et al. (2014), the white stars are the semi-analytical calculation of NSC BH seed from Devecchi et al. (2012) assuming an average mass of 700 M⊙. |
| In the text | |
|
Fig. B.1. Chi square histogram from the parameter exploration for a given observable. From top to bottom: JWST bolometric LF, JWST BHMF, UVLF LBGs, and SMF. For each, we show in blue the models that are within the 50th percentile, and as a red vertical dashed line the model that satisfies our criteria of best overall fit |
| In the text | |
|
Fig. B.2. Stellar mass function of the fiducial model for redshifts 5, 6, 7, 8, 10 and 12. Observational data comes from Duncan et al. 2014; Song et al. 2016; Bhatawdekar et al. 2019; Stefanon et al. 2021; Navarro-Carrera et al. 2024; Harvey et al. 2025. |
| In the text | |
|
Fig. B.3. UV luminosity function of the fiducial model for redshifts 5 to 14. Observational data come from Bouwens et al. (2022, 2021, 2023), Harikane et al. (2022, 2023a, 2024), Pérez-González et al. (2023), Atek et al. (2015, 2018), Oesch et al. (2018), Adams et al. (2022), Donnan et al. (2022, 2024), Bowler et al. (2017), Willott et al. (2024), Naidu et al. (2022), McLeod et al. (2024), Robertson et al. (2024), Whitler et al. (2025), Leung et al. (2023), Adams et al. (2024), Casey et al. (2024). |
| In the text | |
Current usage metrics show cumulative count of Article Views (full-text article views including HTML views, PDF and ePub downloads, according to the available data) and Abstracts Views on Vision4Press platform.
Data correspond to usage on the plateform after 2015. The current usage metrics is available 48-96 hours after online publication and is updated daily on week days.
Initial download of the metrics may take a while.