Fig. 1.
Download original image
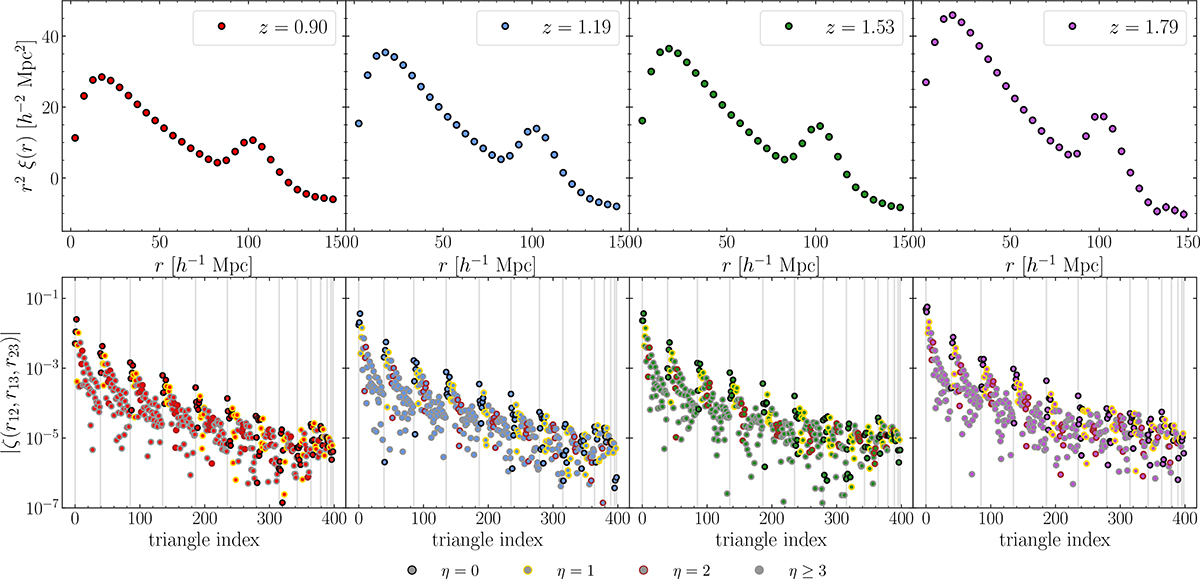
Top panels: 2PCF measurements for four comoving snapshots from the Flagship I simulation of the Model 3 HOD. Bottom panels: Same but for the 3PCF measurements. The triangular configurations are ordered by increasing values of r12, r13, and r23 under the condition r12 ≤ r13 ≤ r23, as depicted in Fig. A.1. The circles are colour-coded according to the η, while the vertical grey lines mark a group of triangles that share the same value of the smaller side (r12).
Current usage metrics show cumulative count of Article Views (full-text article views including HTML views, PDF and ePub downloads, according to the available data) and Abstracts Views on Vision4Press platform.
Data correspond to usage on the plateform after 2015. The current usage metrics is available 48-96 hours after online publication and is updated daily on week days.
Initial download of the metrics may take a while.