Fig. 3.
Download original image
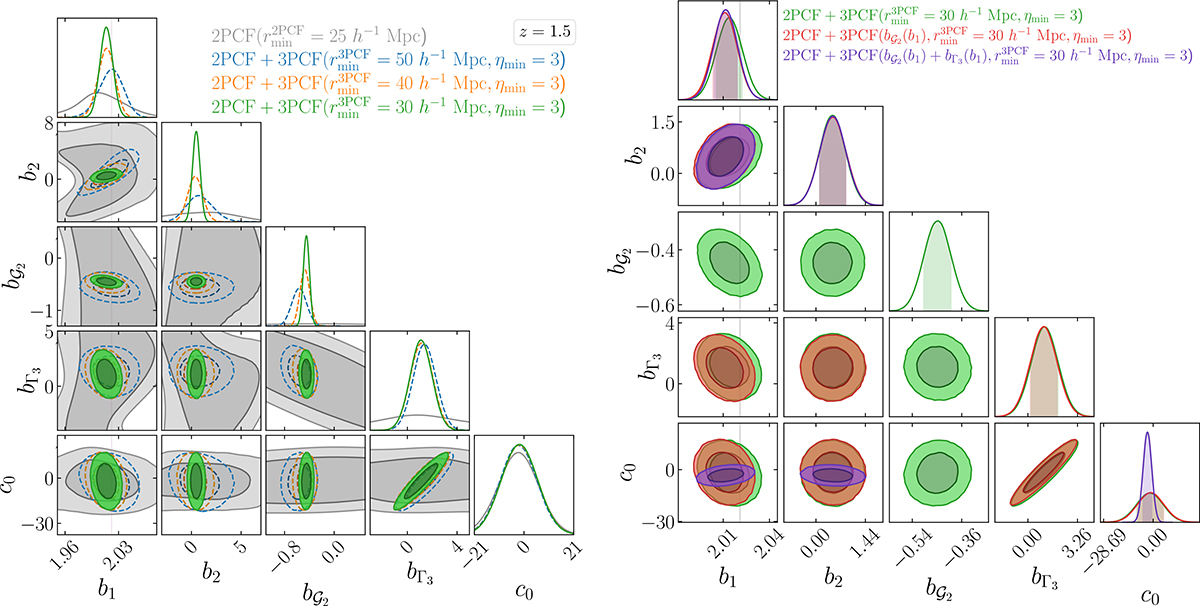
Left panel: Marginalised 2D constraints at confidence intervals of 68.3% and 99.5%, on the nuisance parameters (bias and counter-term) from the 2PCF analysis (grey shaded areas) against the joint 2PCF and 3PCF analysis for several values of ![]() at z = 1.5 (dashed blue lines, dashed orange lines, and green shaded areas). All cases assume η = 3; see Eq. (40). The vertical grey band is an estimate of the linear bias b1 obtained from a comparison of the galaxy power spectrum with measurements of the matter power spectrum in Euclid Collaboration: Pezzotta et al. (2024). Right panel: Marginalised 2D constraints at confidence intervals of 68.3% and 99.5%, on the nuisance parameters (bias and counter-term) from the joint 2PCF-3PCF analysis at z = 1.5 for
at z = 1.5 (dashed blue lines, dashed orange lines, and green shaded areas). All cases assume η = 3; see Eq. (40). The vertical grey band is an estimate of the linear bias b1 obtained from a comparison of the galaxy power spectrum with measurements of the matter power spectrum in Euclid Collaboration: Pezzotta et al. (2024). Right panel: Marginalised 2D constraints at confidence intervals of 68.3% and 99.5%, on the nuisance parameters (bias and counter-term) from the joint 2PCF-3PCF analysis at z = 1.5 for ![]() (red contours) compared to the same set-up but with the assumption of the b𝒢2(b1) bias relation alone (red contours) and the combination of the relations b𝒢2(b1) and bΓ3(b1) (violet contours).
(red contours) compared to the same set-up but with the assumption of the b𝒢2(b1) bias relation alone (red contours) and the combination of the relations b𝒢2(b1) and bΓ3(b1) (violet contours).
Current usage metrics show cumulative count of Article Views (full-text article views including HTML views, PDF and ePub downloads, according to the available data) and Abstracts Views on Vision4Press platform.
Data correspond to usage on the plateform after 2015. The current usage metrics is available 48-96 hours after online publication and is updated daily on week days.
Initial download of the metrics may take a while.