Fig. 6.
Download original image
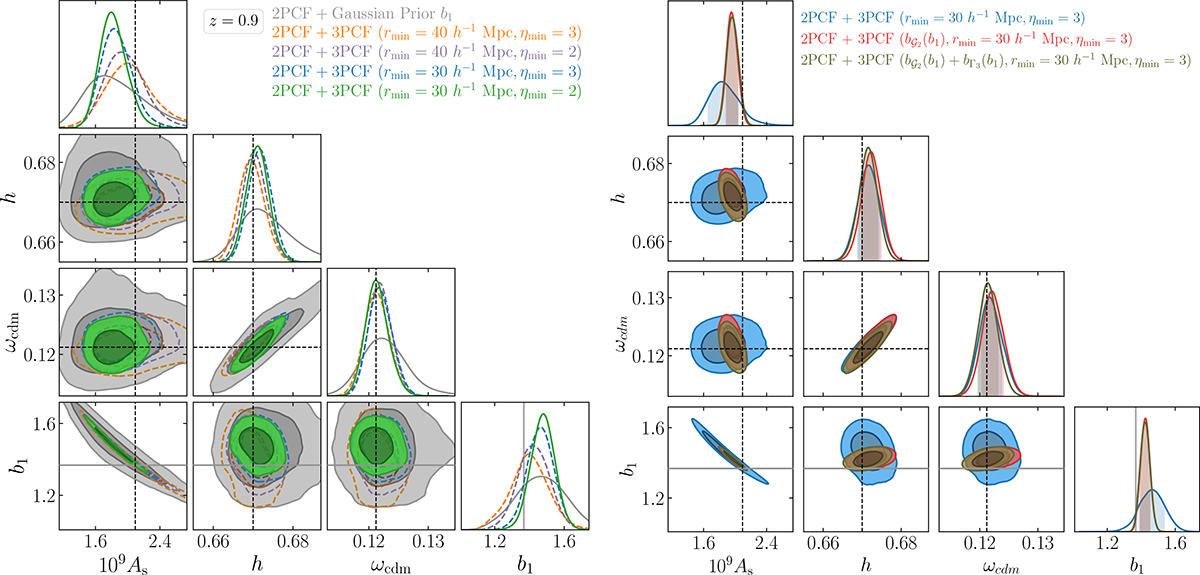
Left panel: Marginalised 2D and 1D posterior distributions at z = 0.9 from the joint 2PCF and 3PCF analysis of the cosmological parameters h, ωcdm, and As and the linear bias parameter b1 for various 3PCF scale cuts (![]() ) and the ηmin parameter defined in Eq. (40), fixing
) and the ηmin parameter defined in Eq. (40), fixing ![]() . Grey contours correspond to the 2PCF-only analysis assuming a Gaussian prior on b1 given by the 10% uncertainties around the best-fit value obtained from the joint analysis. Each panel shows the results for a different snapshot. Vertical and horizontal lines denote the fiducial values of the cosmological parameters. Right panel: Marginalised 1D and 2D posterior distributions of the same subset of model parameters for the combined analysis of 2PCF and 3PCF at z = 0.9 fixing
. Grey contours correspond to the 2PCF-only analysis assuming a Gaussian prior on b1 given by the 10% uncertainties around the best-fit value obtained from the joint analysis. Each panel shows the results for a different snapshot. Vertical and horizontal lines denote the fiducial values of the cosmological parameters. Right panel: Marginalised 1D and 2D posterior distributions of the same subset of model parameters for the combined analysis of 2PCF and 3PCF at z = 0.9 fixing ![]() . The reference case of the maximal model with
. The reference case of the maximal model with ![]() and ηmin = 3 is compared to the results obtained adopting the bias relations of Eq. (16), in red, and its combination with Eq. (17), in brown.
and ηmin = 3 is compared to the results obtained adopting the bias relations of Eq. (16), in red, and its combination with Eq. (17), in brown.
Current usage metrics show cumulative count of Article Views (full-text article views including HTML views, PDF and ePub downloads, according to the available data) and Abstracts Views on Vision4Press platform.
Data correspond to usage on the plateform after 2015. The current usage metrics is available 48-96 hours after online publication and is updated daily on week days.
Initial download of the metrics may take a while.