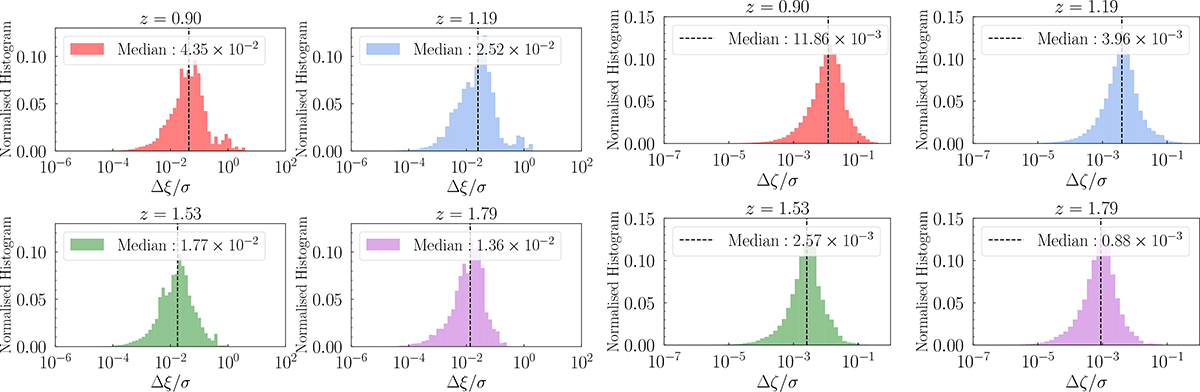
Fig. B.1.
Download original image
Normalised histogram of the ratio between the difference between emulated and exact modelling 2PCF predictions and the corresponding uncertainty, Δξ/σξ (top four panels). Different colours refer to different redshift snapshot, while the dashed black line represents the median of the distribution. The same quantity for the 3PCF, Δζ/σζ, is shown in the bottom four panels, for the different redshifts.
Current usage metrics show cumulative count of Article Views (full-text article views including HTML views, PDF and ePub downloads, according to the available data) and Abstracts Views on Vision4Press platform.
Data correspond to usage on the plateform after 2015. The current usage metrics is available 48-96 hours after online publication and is updated daily on week days.
Initial download of the metrics may take a while.