Fig. 10.
Download original image
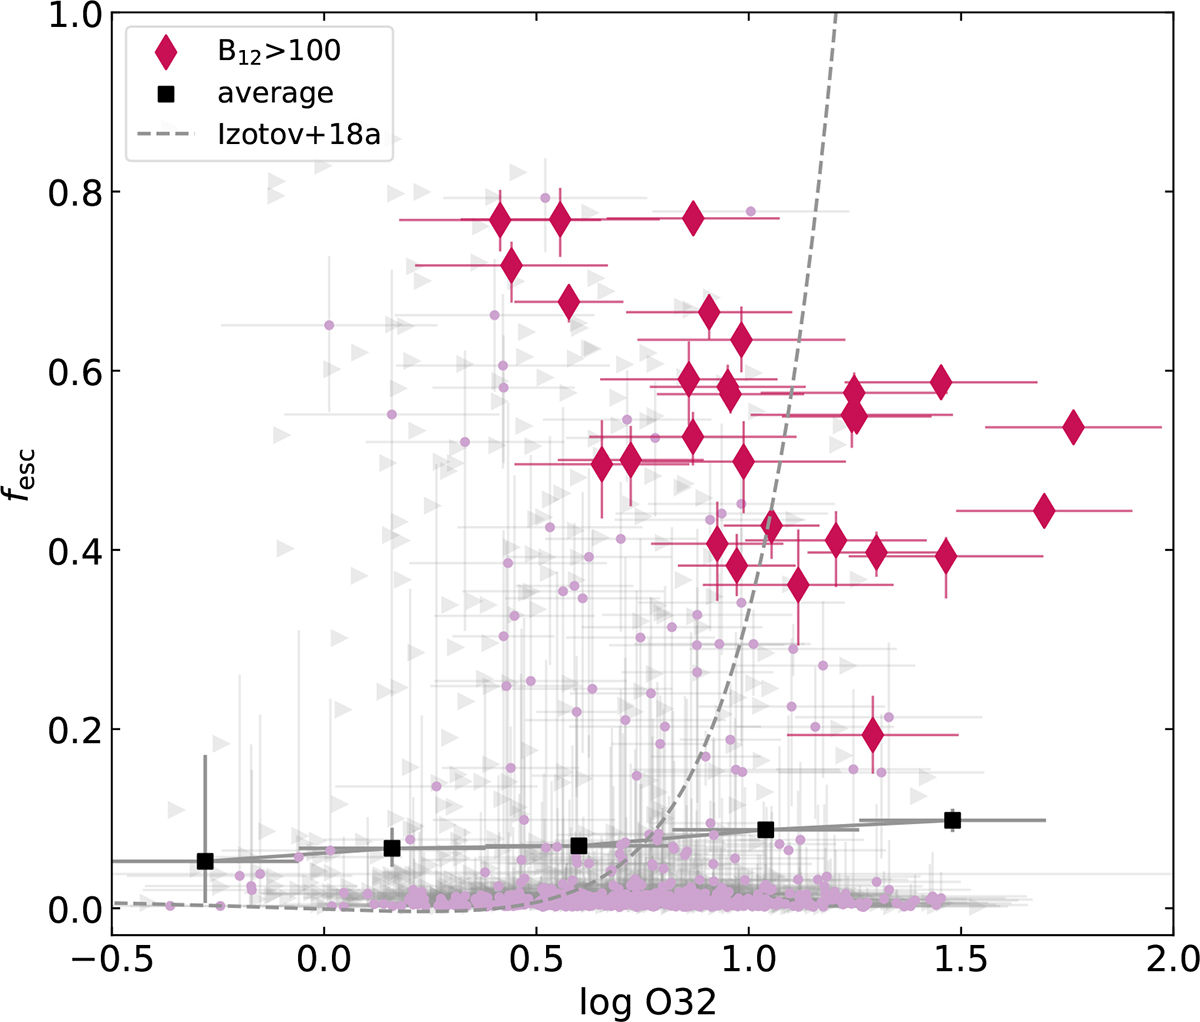
Relation between fesc and O32, with the average fesc shown as black squares, in bins on log(O32). The diamond points represent the high-confidence sample, and the dots show the parent sample. The dashed gray line shows the relation between fesc and O32 form Izotov et al. (2018a). The gray triangles indicate lower limits on the O32 ratio for the points with S/N([O II]) < 3. Our points show no strong trend between ⟨fesc⟩ and O32.
Current usage metrics show cumulative count of Article Views (full-text article views including HTML views, PDF and ePub downloads, according to the available data) and Abstracts Views on Vision4Press platform.
Data correspond to usage on the plateform after 2015. The current usage metrics is available 48-96 hours after online publication and is updated daily on week days.
Initial download of the metrics may take a while.