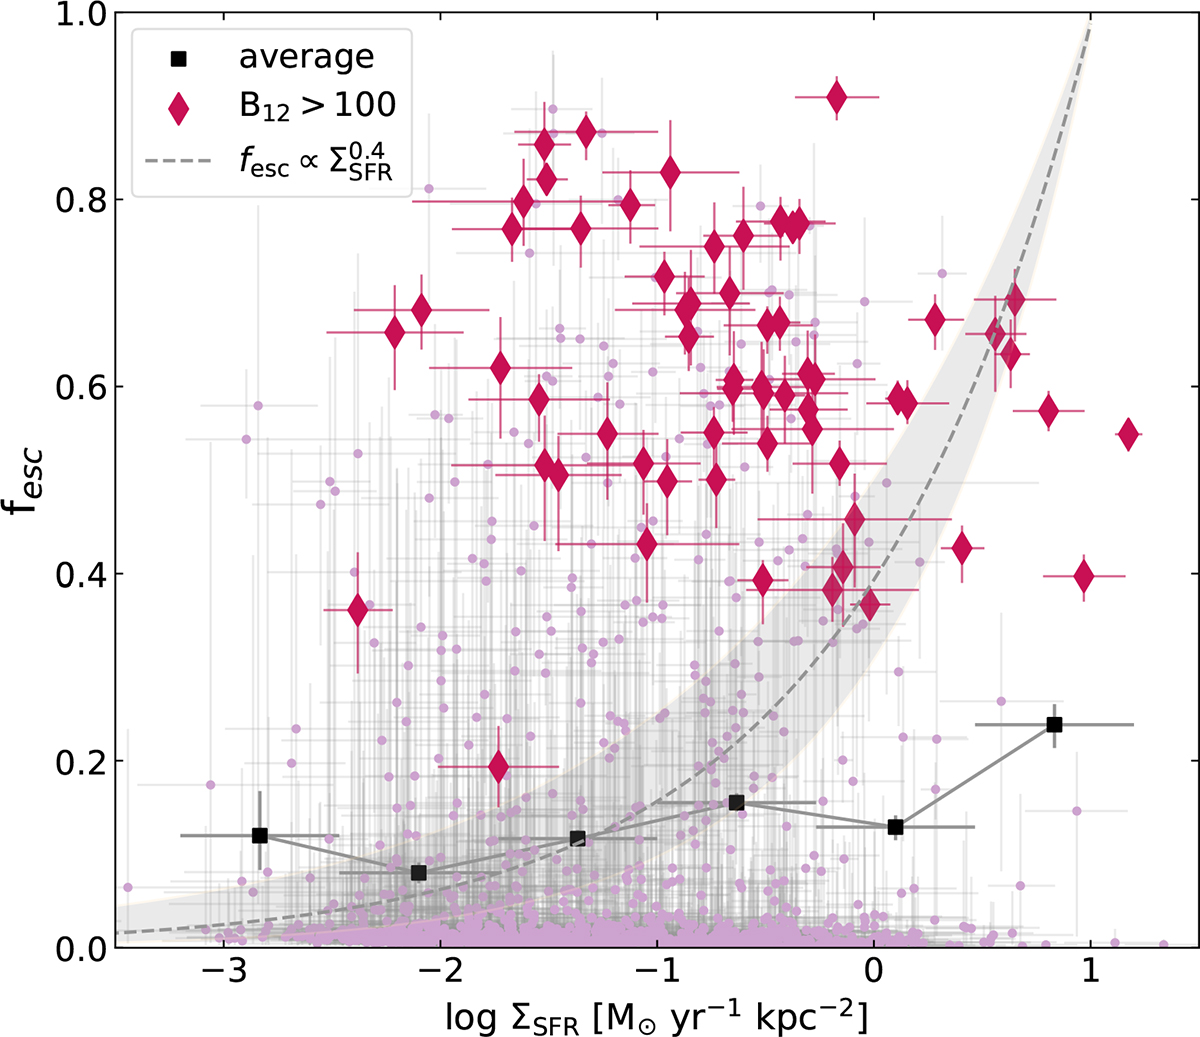
Fig. 11.
Download original image
fesc versus star formation rate surface density. The high-confidence sample is shown with the dark diamonds, and the average fesc is shown with the black squares. Our sample does not show any significant trend of higher fesc with higher ΣSFR, as was expected from the proposed relation from Naidu et al. (2020) that is shown as the dashed line.
Current usage metrics show cumulative count of Article Views (full-text article views including HTML views, PDF and ePub downloads, according to the available data) and Abstracts Views on Vision4Press platform.
Data correspond to usage on the plateform after 2015. The current usage metrics is available 48-96 hours after online publication and is updated daily on week days.
Initial download of the metrics may take a while.