Open Access
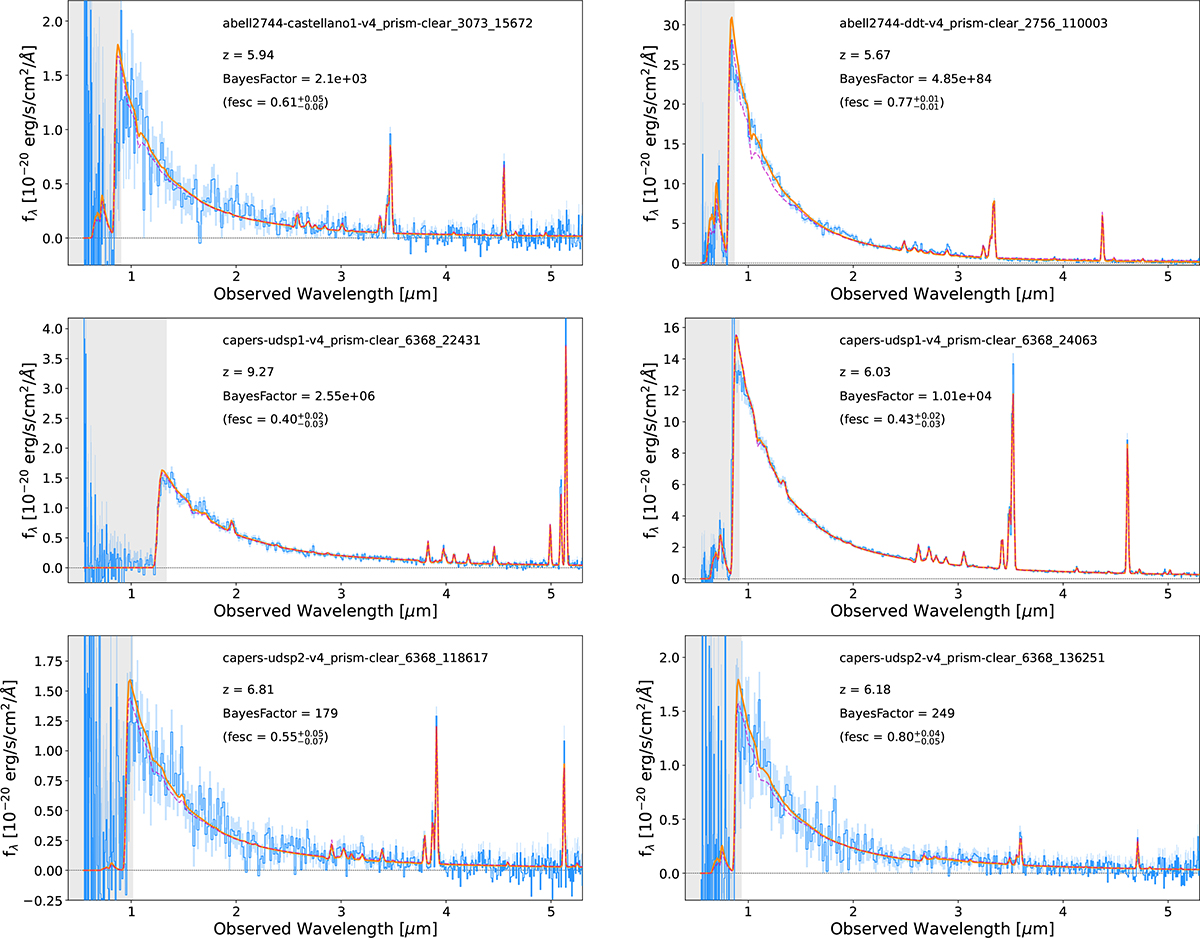
Fig. A.1.
Download original image
Fits of high confidence sample sources. Just as in Figure 3 The orange line represents the high fesc fit, the magenta dashed line represents the fesc = 0. The grey shaded area represents the region masked when performing the fit.
Current usage metrics show cumulative count of Article Views (full-text article views including HTML views, PDF and ePub downloads, according to the available data) and Abstracts Views on Vision4Press platform.
Data correspond to usage on the plateform after 2015. The current usage metrics is available 48-96 hours after online publication and is updated daily on week days.
Initial download of the metrics may take a while.