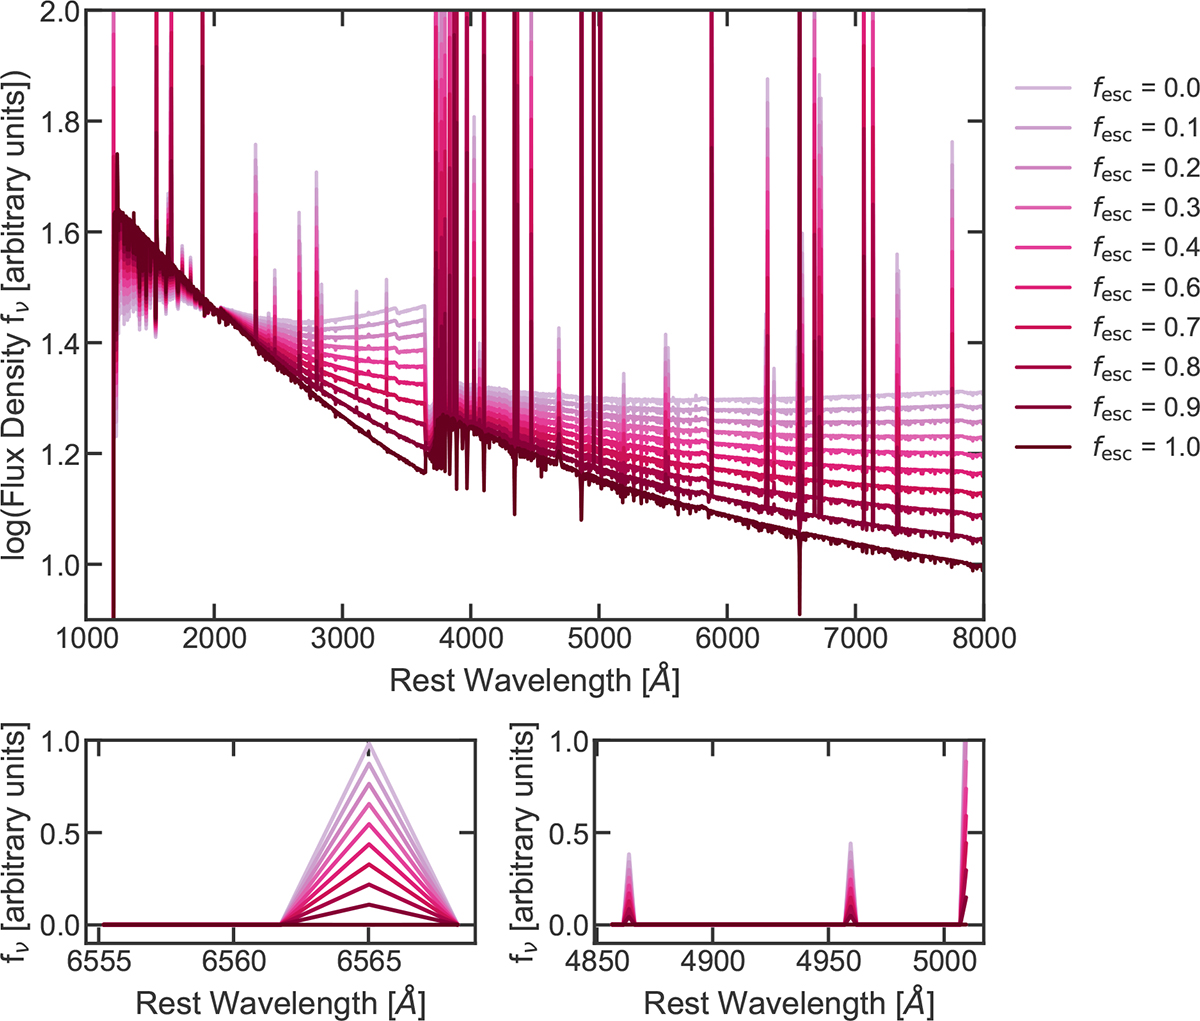
Fig. 2.
Download original image
Top: spectrum of a model galaxy with various fesc. The model galaxy is at z = 6 and has a mass of M* = 109 M⊙, metallicity of Z = 0.05 Z⊙, ionization parameter of log U = −2, constant star formation switched on at 5 Myr, and dust modelled via the Calzetti (Calzetti et al. 2000) dust curve with Av = 0.2. As fesc increases, the βUV slope becomes steeper due to reduced nebular continuum emission, and the emission lines become weaker. The continuum emission is also affected as its nebular component scales with fesc. The full spectrum thus contains information on the escape fractions, which we exploited to constrain the fesc of galaxies with NIRSpec spectra. Bottom left: zoomed-in view of Hα. Bottom right: zoomed-in view of Hβ+[O III].
Current usage metrics show cumulative count of Article Views (full-text article views including HTML views, PDF and ePub downloads, according to the available data) and Abstracts Views on Vision4Press platform.
Data correspond to usage on the plateform after 2015. The current usage metrics is available 48-96 hours after online publication and is updated daily on week days.
Initial download of the metrics may take a while.