Fig. 3.
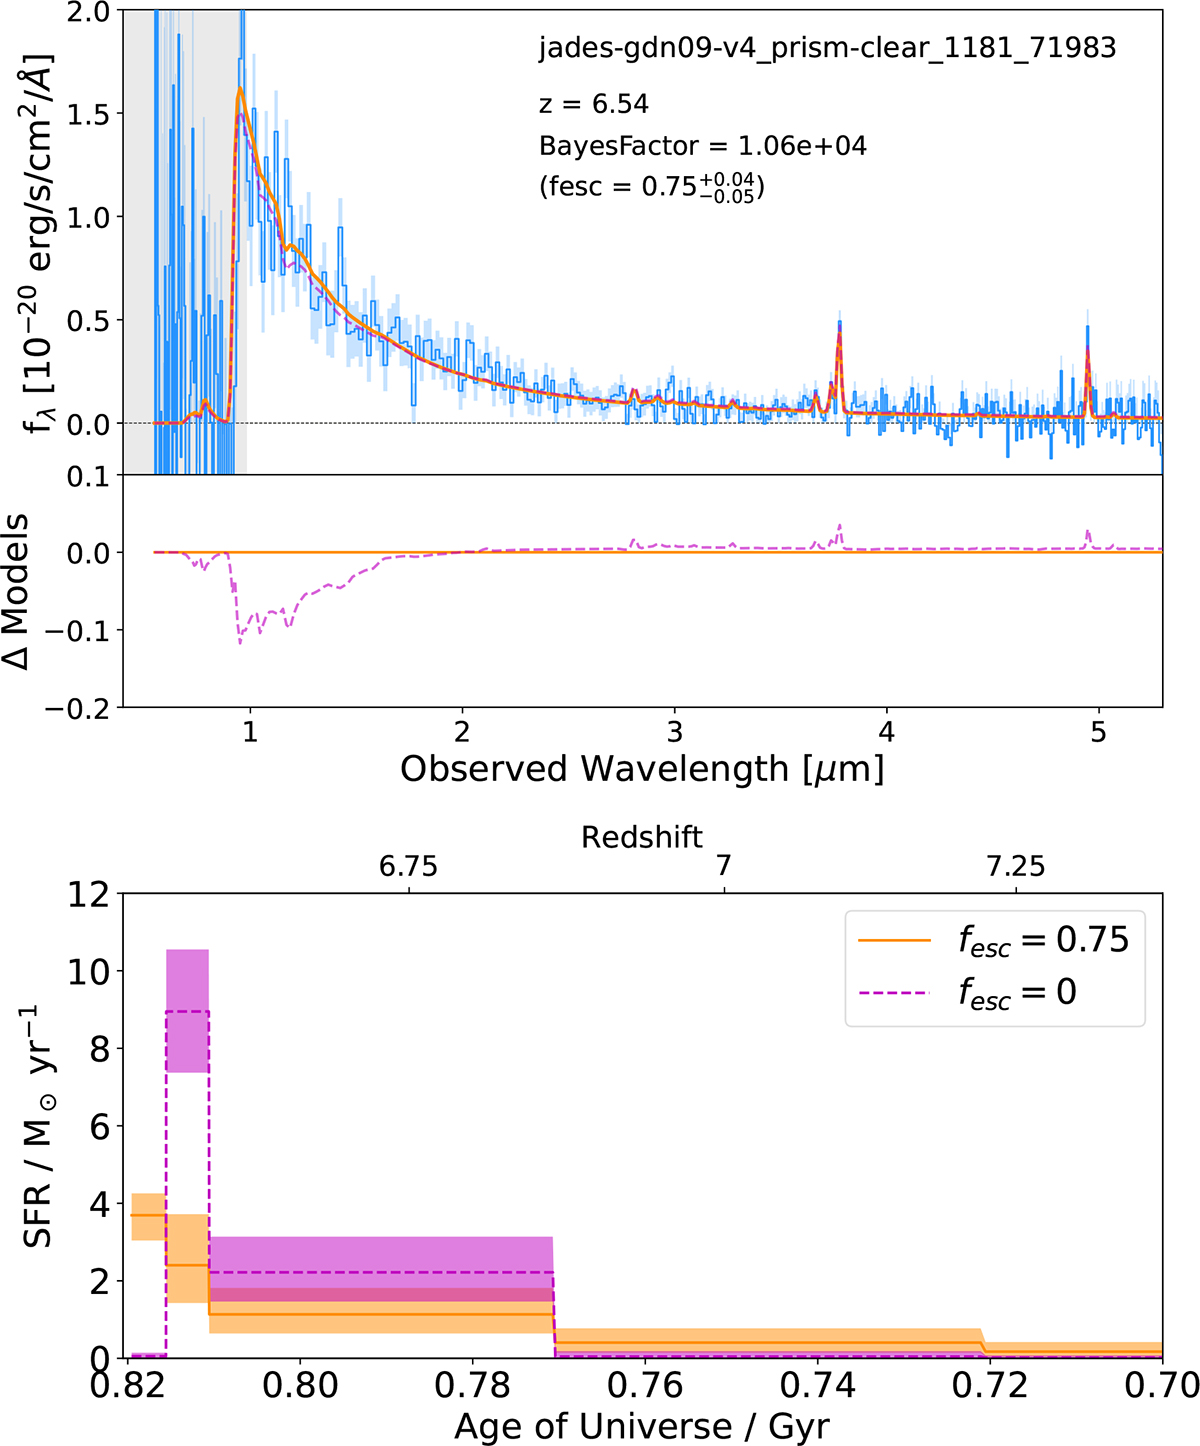
Download original image
Example galaxy with Bayes factor > 100. Top: observed spectrum (blue line) and the two models, one with high fesc (solid orange line) and one with fesc = 0 (dashed magenta line). The shaded gray region represents the masked area. A clear difference between the two models can be seen in the βUV part of the spectrum, where the high fesc solution fits the data much better than the other solution. Middle: difference between two models highlighting the difference in the βUV slope and to some extent in the emission-line strengths. Bottom: Comparison of SFH for the two models. The models are extremely different, as reproducing the weak lines and steep βUV slope without fesc is only possible with a recent quenching of star formation. This indicates a degeneracy between SFH and fesc, which is discussed further in Section 7.
Current usage metrics show cumulative count of Article Views (full-text article views including HTML views, PDF and ePub downloads, according to the available data) and Abstracts Views on Vision4Press platform.
Data correspond to usage on the plateform after 2015. The current usage metrics is available 48-96 hours after online publication and is updated daily on week days.
Initial download of the metrics may take a while.