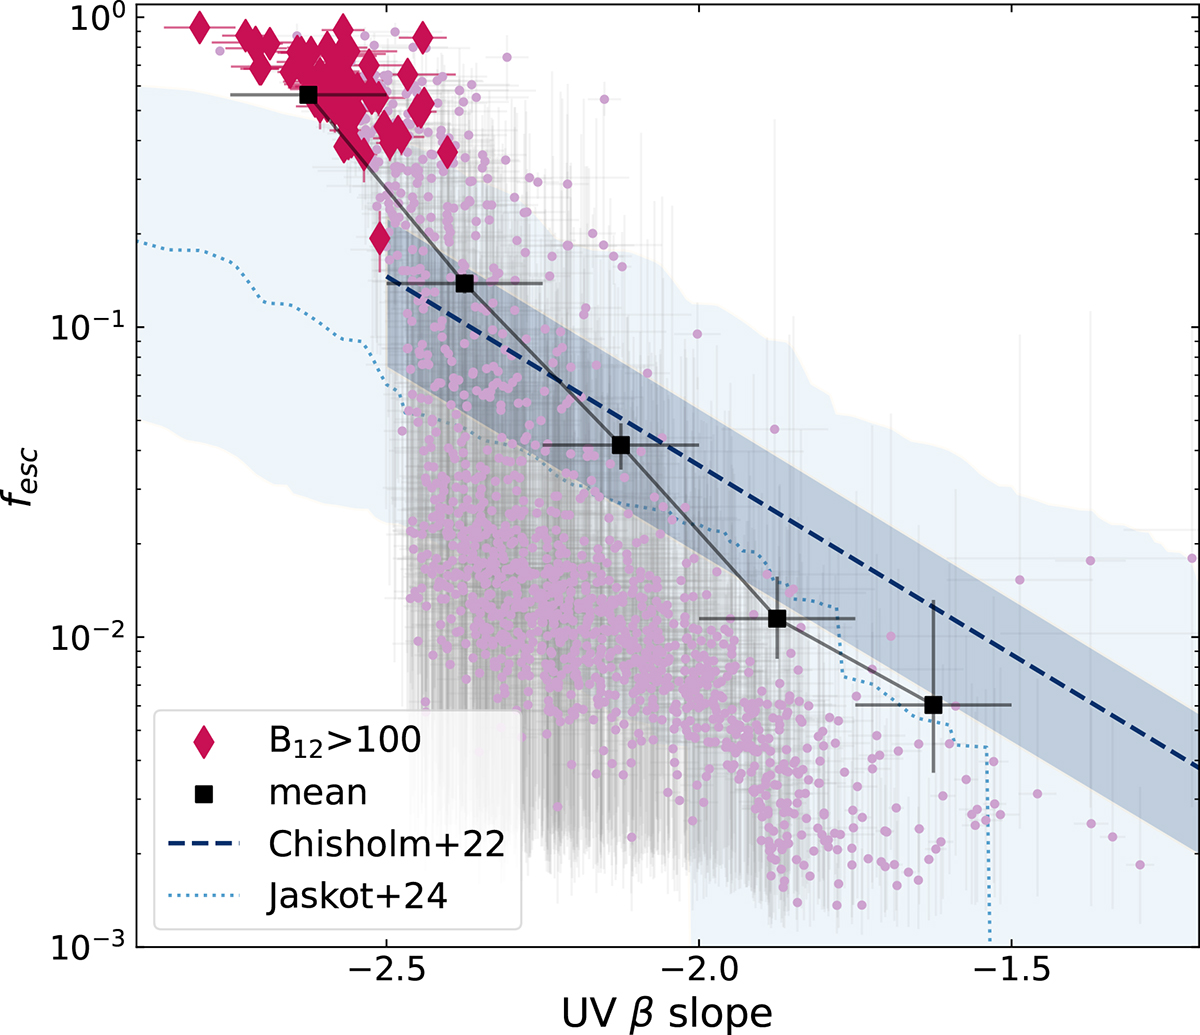
Fig. 6.
Download original image
fesc versus βUV slope. The darker diamond points highlight the high-confidence sample, while the dots represent the parent sample. The squares represent the average fesc in βUV bins, calculated from the parent sample. The fesc − βUV relation from Chisholm et al. (2022) is shown as the dashed line, with the uncertainty shown as the shaded area. With the dotted line, we show the results of Jaskot et al. (2024a), using the LyCsurv code (Flury et al. 2024). The average fesc decreases as the βUV slope becomes bluer.
Current usage metrics show cumulative count of Article Views (full-text article views including HTML views, PDF and ePub downloads, according to the available data) and Abstracts Views on Vision4Press platform.
Data correspond to usage on the plateform after 2015. The current usage metrics is available 48-96 hours after online publication and is updated daily on week days.
Initial download of the metrics may take a while.