Fig. 7.
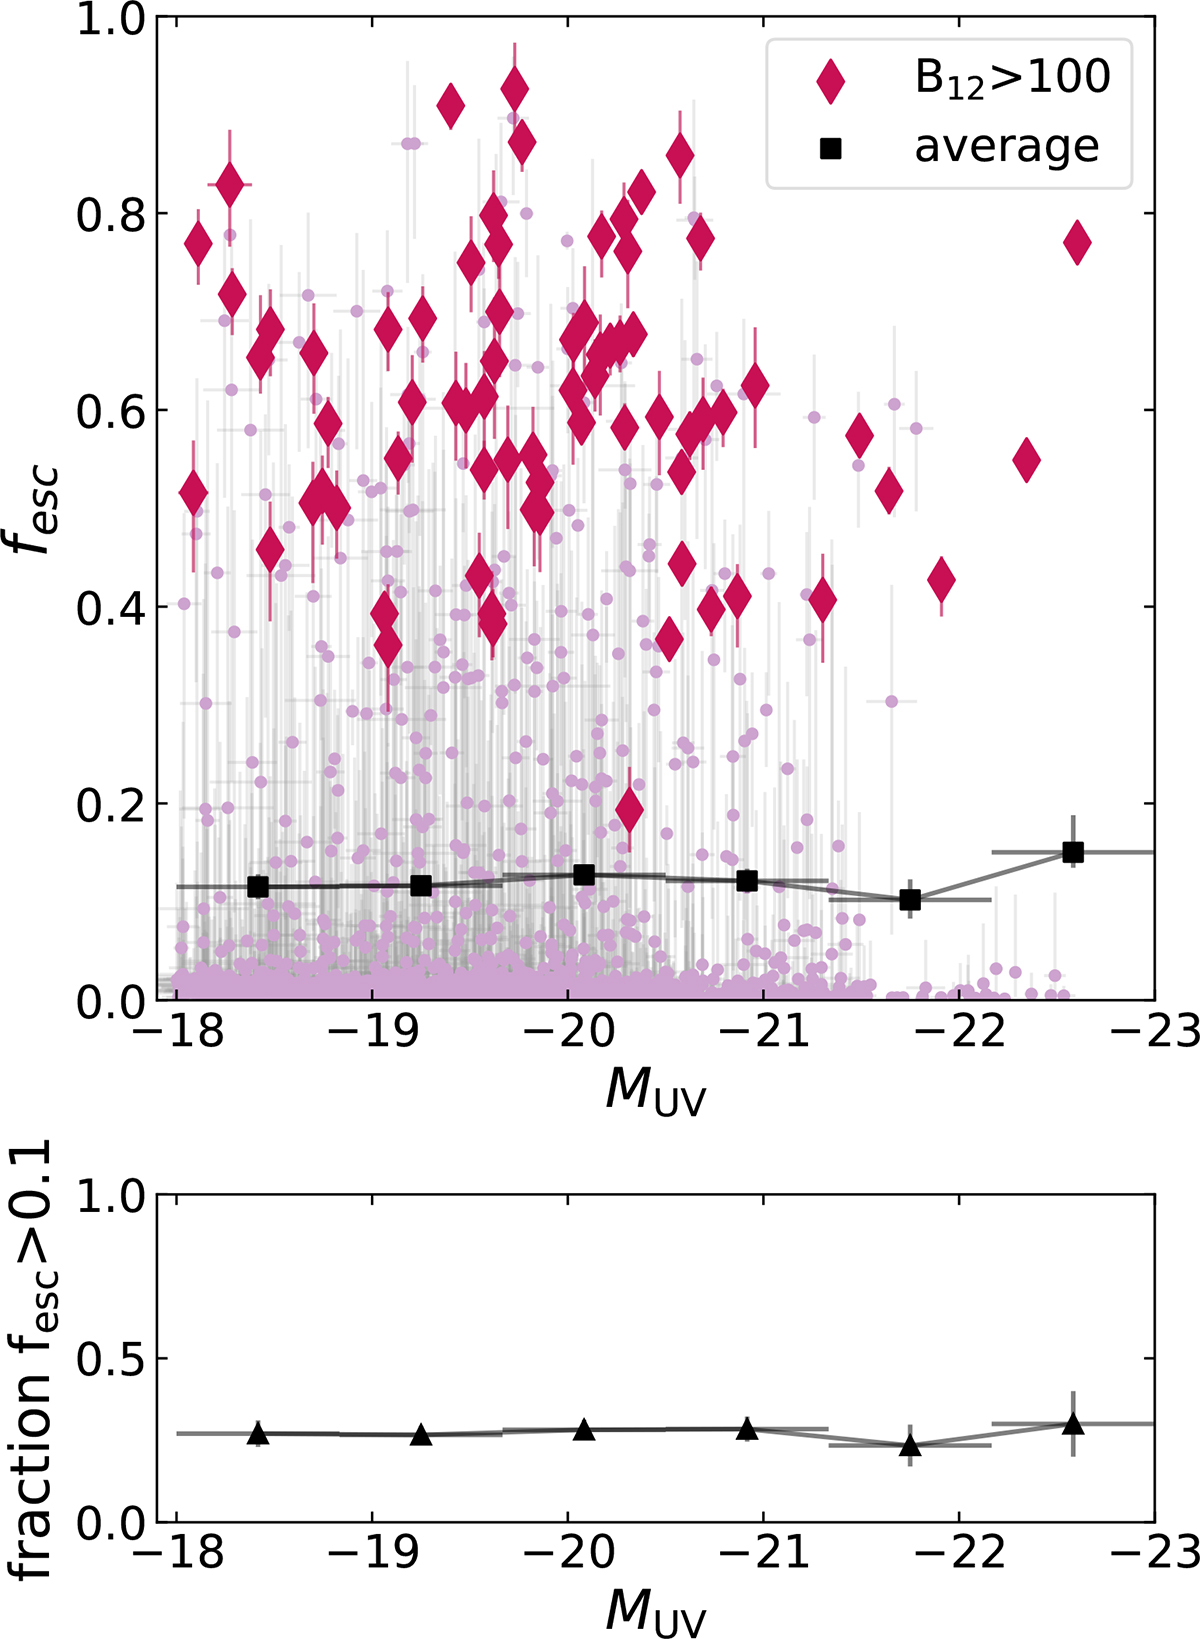
Download original image
Top: fesc versus MUV. The parent sample is shown with the pink dots, the high-confidence sample is shown by the dark diamonds, and the average fesc in bins of MUV is shown as the black squares. The mean fesc does not show a trend with MUV. The average fesc of our sample is consistently measured between 10 and 15% in all bins. Bottom: fraction of sources with fesc > 0.1 in each UV magnitude bin. This fraction also shows no trend with MUV.
Current usage metrics show cumulative count of Article Views (full-text article views including HTML views, PDF and ePub downloads, according to the available data) and Abstracts Views on Vision4Press platform.
Data correspond to usage on the plateform after 2015. The current usage metrics is available 48-96 hours after online publication and is updated daily on week days.
Initial download of the metrics may take a while.