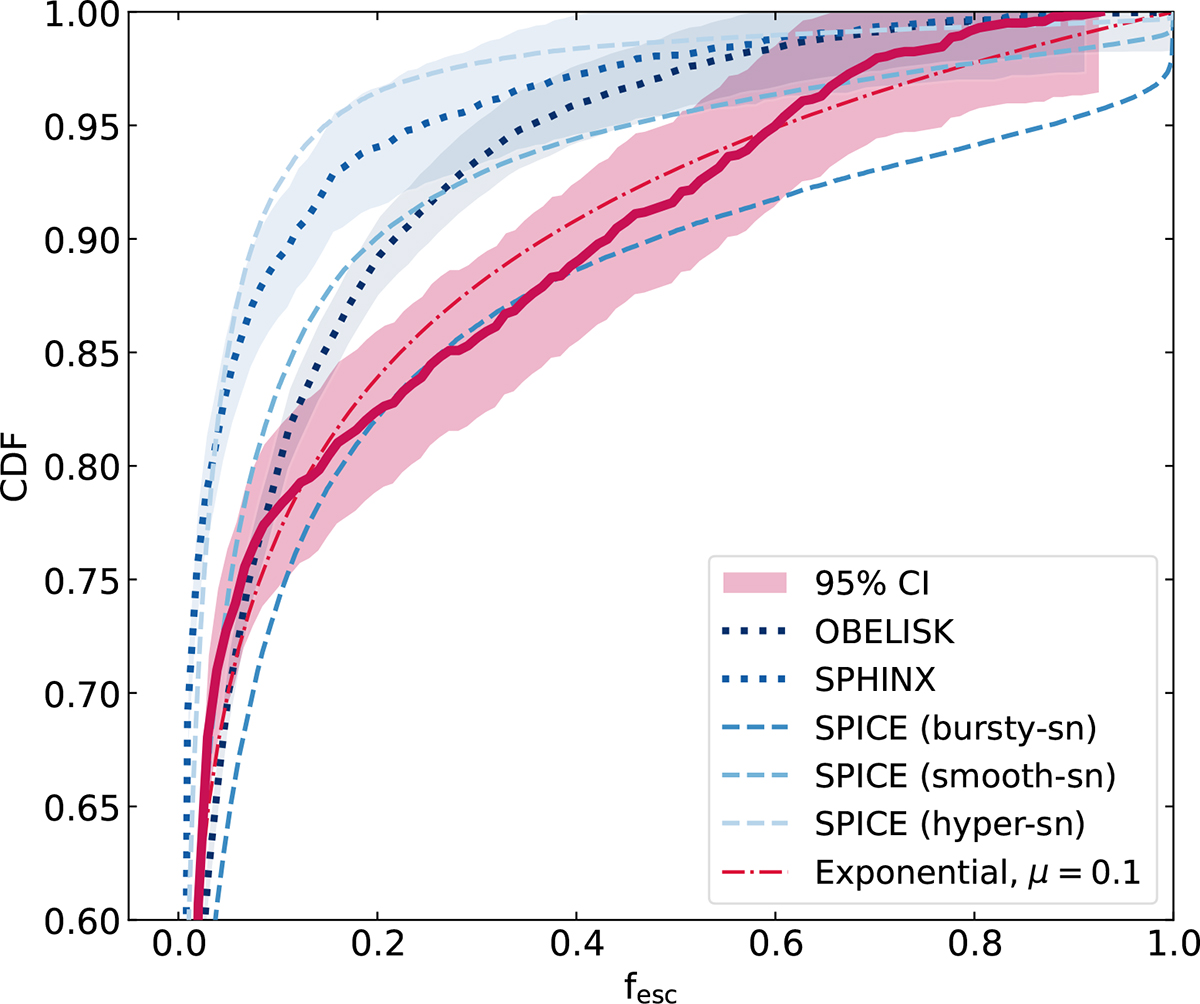
Fig. 8.
Download original image
Empirical cumulative distribution function (CDF) of fesc in the parent sample. The solid dark pink line shows the CDF for our data, with the shaded area representing the 95% confidence interval. The dotted lines with the shaded areas show the CDF of different simulations, including SPHINX and OBELISK, with the respective 95% confidence interval. The dashed blue lines show the three realizations of the SPICE simulation. The dot-dashed purple line represents a simple exponential distribution with a mean of 10%, as justified by the results of Figure 7, and which fits our CDF rather well. All models consistently predict mostly low-fesc objects, with a few high-fesc sources that drive the mean fesc to non-negligible values.
Current usage metrics show cumulative count of Article Views (full-text article views including HTML views, PDF and ePub downloads, according to the available data) and Abstracts Views on Vision4Press platform.
Data correspond to usage on the plateform after 2015. The current usage metrics is available 48-96 hours after online publication and is updated daily on week days.
Initial download of the metrics may take a while.