Open Access
Fig. 1
Download original image
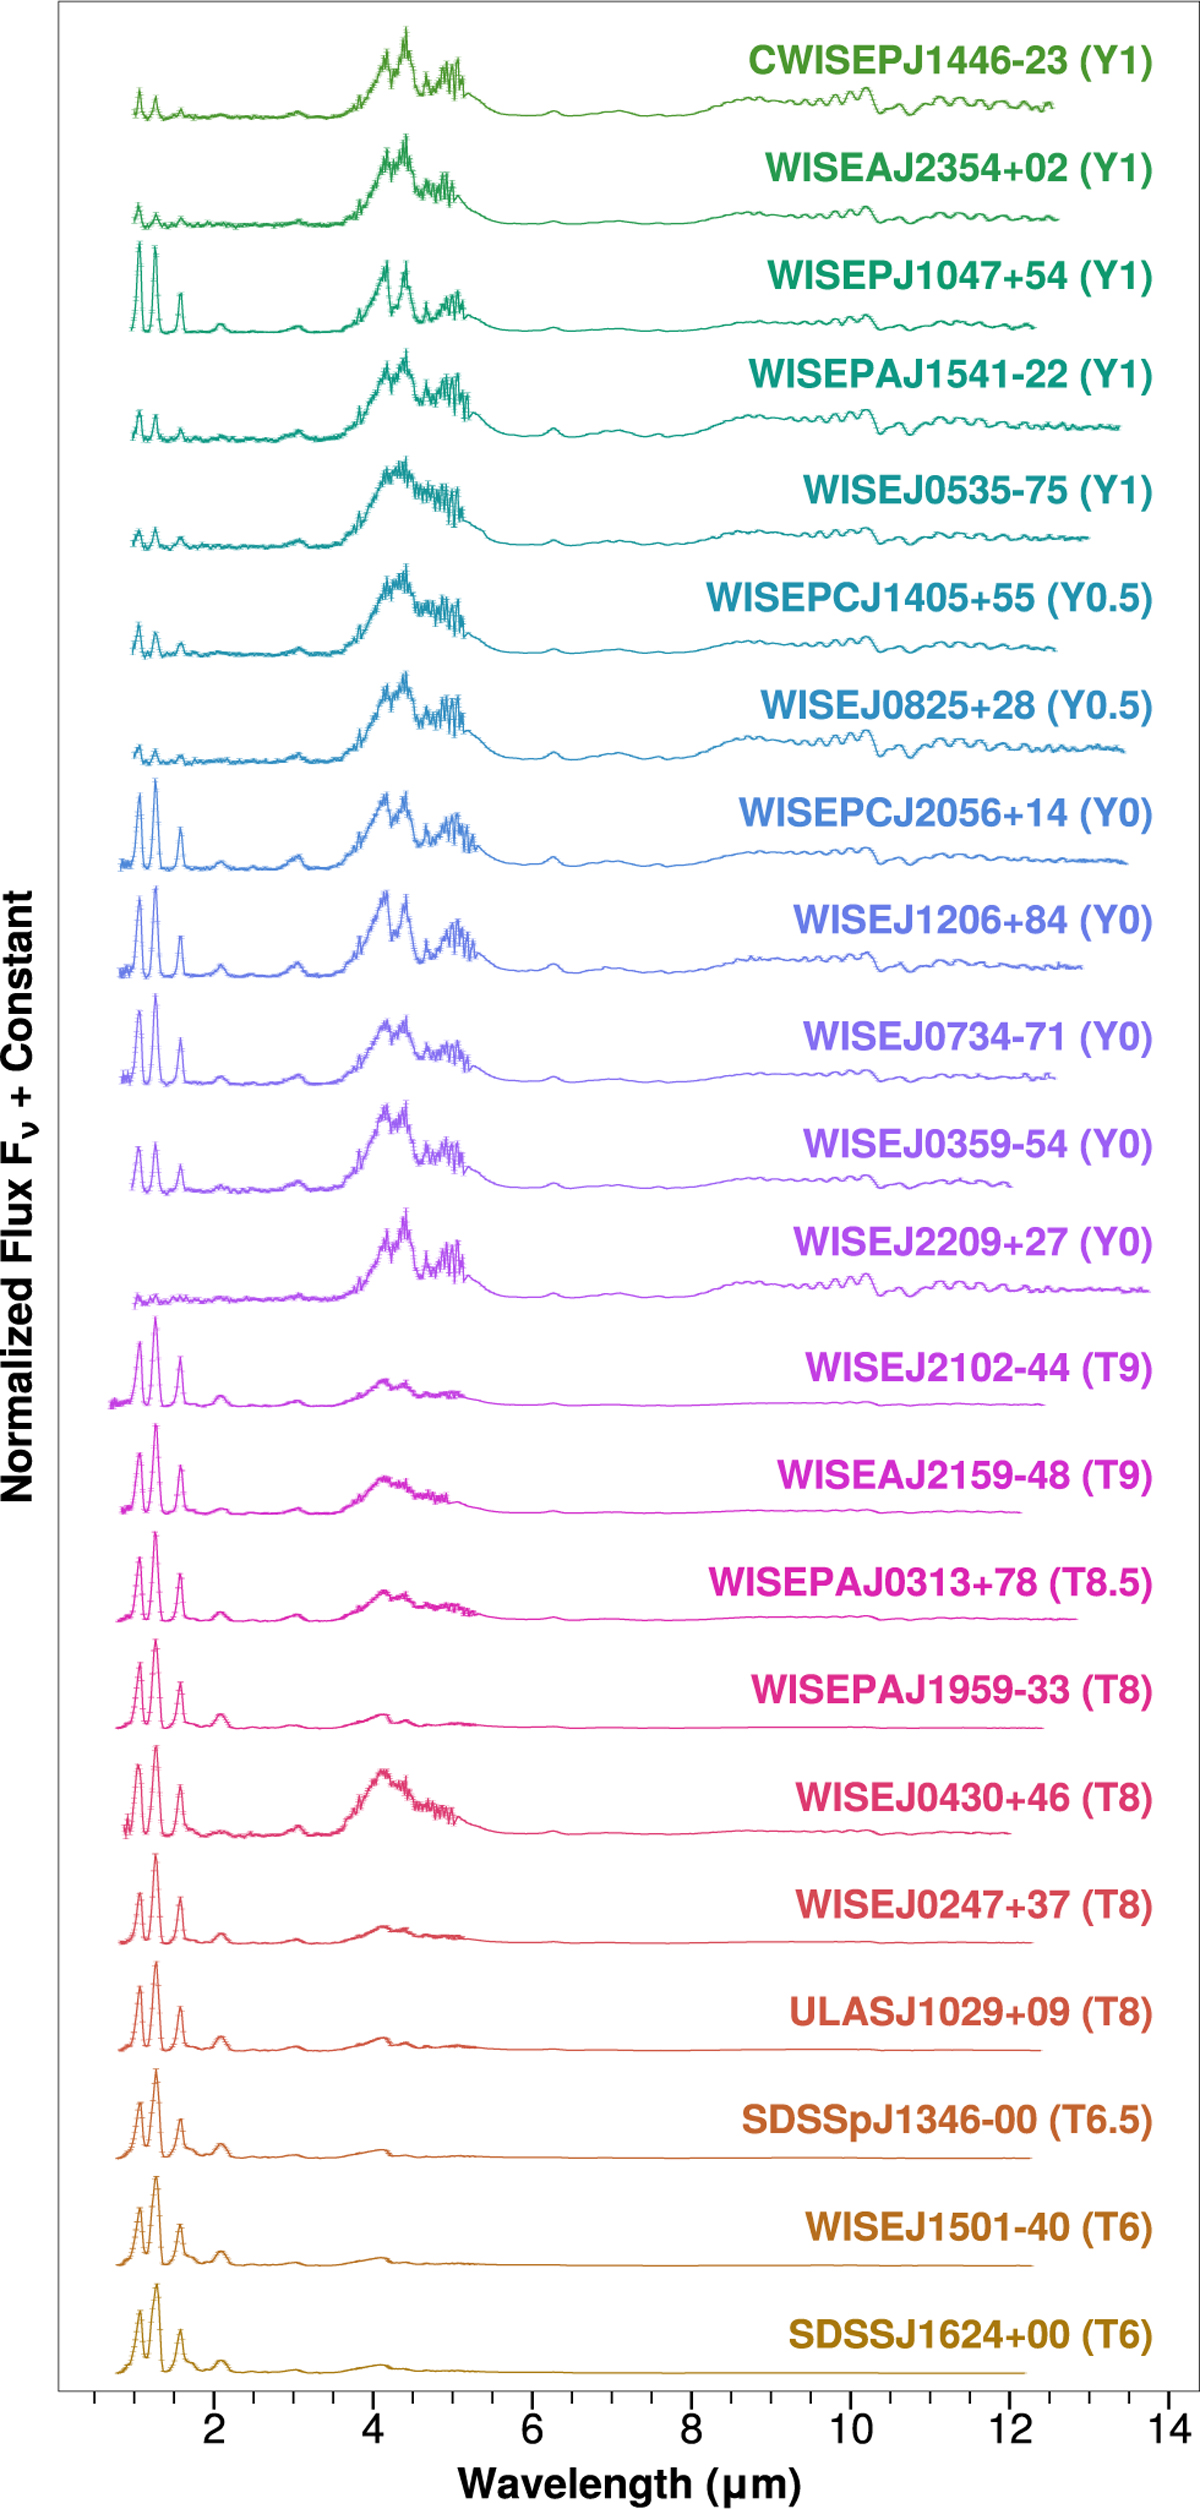
Spectral sample of 22 T and Y dwarfs originally published in Beiler et al. (2024a). All spectra have been normalized at their maximum flux value and offset by a constant.
Current usage metrics show cumulative count of Article Views (full-text article views including HTML views, PDF and ePub downloads, according to the available data) and Abstracts Views on Vision4Press platform.
Data correspond to usage on the plateform after 2015. The current usage metrics is available 48-96 hours after online publication and is updated daily on week days.
Initial download of the metrics may take a while.