Fig. 10.
Download original image
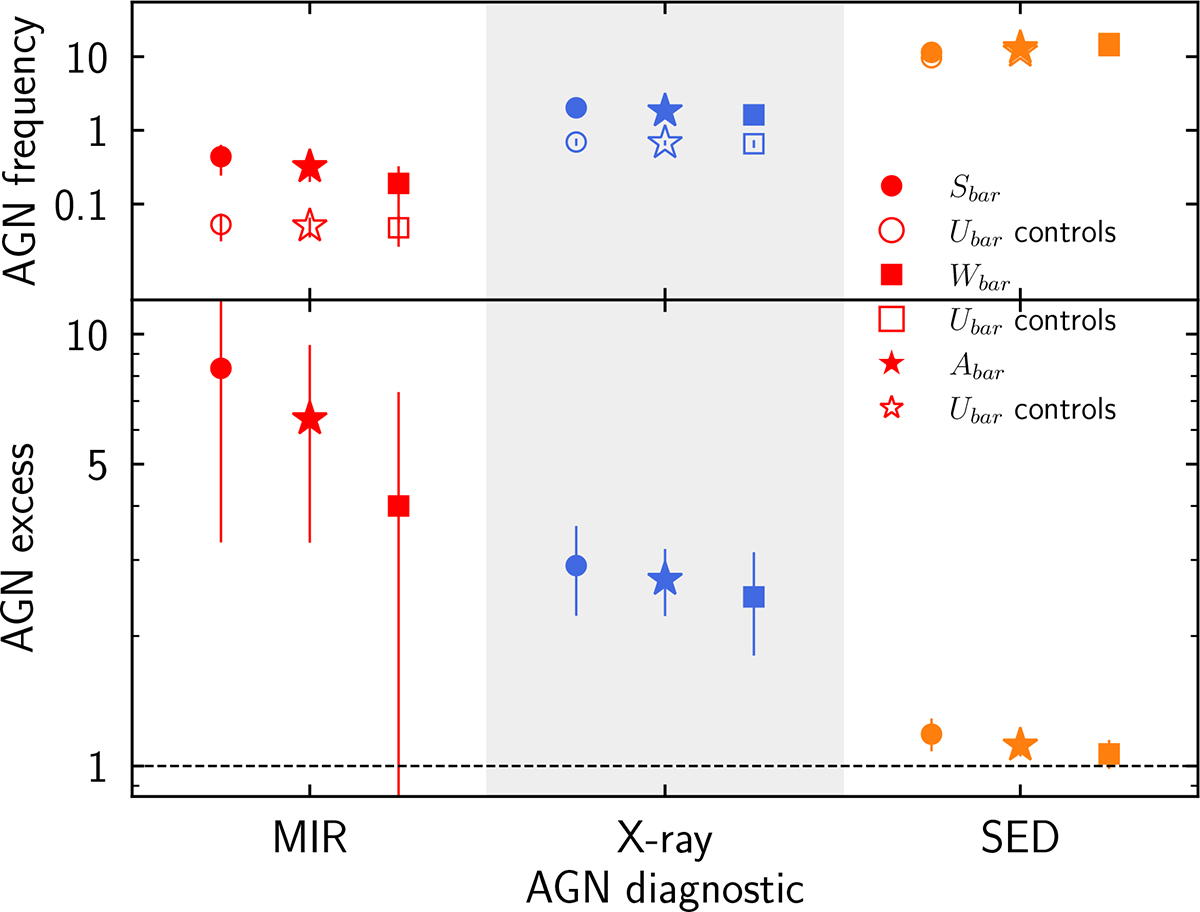
AGN frequency and relative AGN excess in barred vs. unbarred disc galaxies. Top panel: Frequency of AGN (MIR: red, X-ray: blue, SED: orange) in Sbar (circles), Wbar (squares), Abar (stars), and the corresponding Ubar control samples (empty symbols of the same type). Errors are calculated using binomial statistics. Bottom panel: Ratio of the AGN frequency in the barred samples to that in their corresponding Ubar controls (AGN excess).
Current usage metrics show cumulative count of Article Views (full-text article views including HTML views, PDF and ePub downloads, according to the available data) and Abstracts Views on Vision4Press platform.
Data correspond to usage on the plateform after 2015. The current usage metrics is available 48-96 hours after online publication and is updated daily on week days.
Initial download of the metrics may take a while.