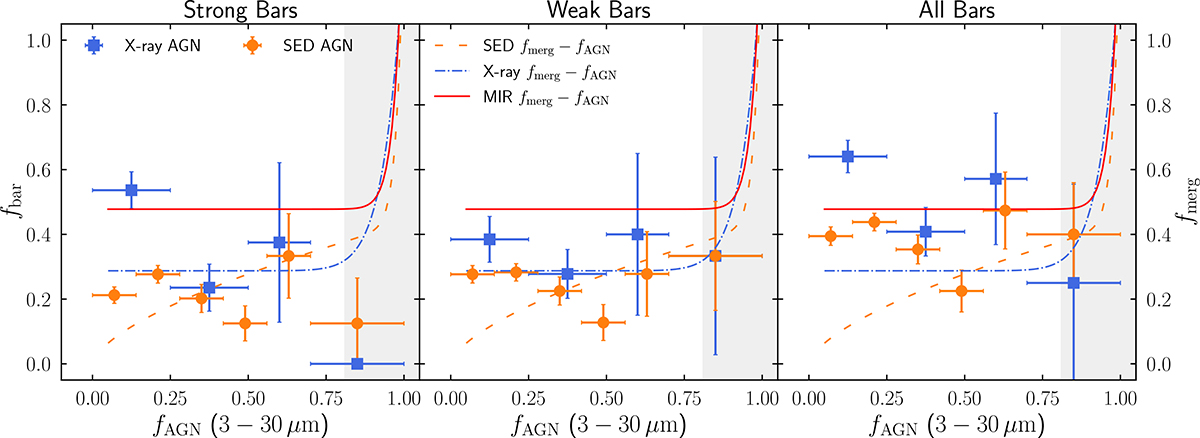
Fig. 13.
Download original image
Bar fraction (fbar) as a function of fAGN for X-ray AGN (blue squares) and SED AGN (orange circles). Results are shown for Sbar, Wbar, and Abar separately. The fbar is calculated in fAGN bins using bootstrapping with resampling. The values reported are the median fbar (with 1σ standard deviations as uncertainties); the x-axis error bars indicate bin width. Overlaid are the best-fit merger fraction (fmerg)–fAGN relations from LM24 for the MIR (solid red line), X-ray (dotted-dashed blue line), and SED (dashed orange line) AGN, parametrised as described in Appendix C. In each subplot, the grey-shaded area highlights the region where fmerg sharply rises as a function of fAGN.
Current usage metrics show cumulative count of Article Views (full-text article views including HTML views, PDF and ePub downloads, according to the available data) and Abstracts Views on Vision4Press platform.
Data correspond to usage on the plateform after 2015. The current usage metrics is available 48-96 hours after online publication and is updated daily on week days.
Initial download of the metrics may take a while.