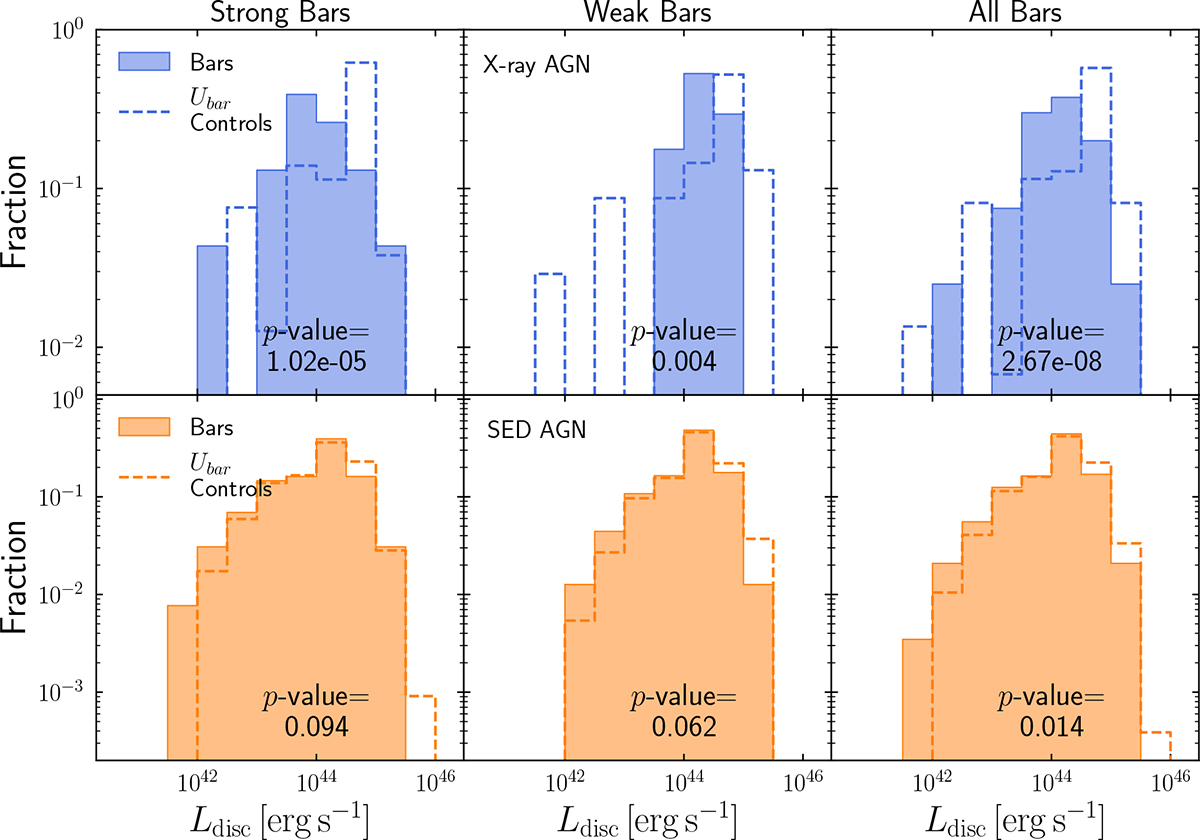
Fig. 14.
Download original image
Normalised distributions of AGN accretion disc luminosity (Ldisc) in X-ray (top panels) and SED (bottom panels) AGN. Distributions are shown for Sbar, Wbar, and Abar (filled histograms) compared to their respective Ubar controls (dashed lines). The p-value from a KS test comparing the barred sample with its control is reported in each panel.
Current usage metrics show cumulative count of Article Views (full-text article views including HTML views, PDF and ePub downloads, according to the available data) and Abstracts Views on Vision4Press platform.
Data correspond to usage on the plateform after 2015. The current usage metrics is available 48-96 hours after online publication and is updated daily on week days.
Initial download of the metrics may take a while.