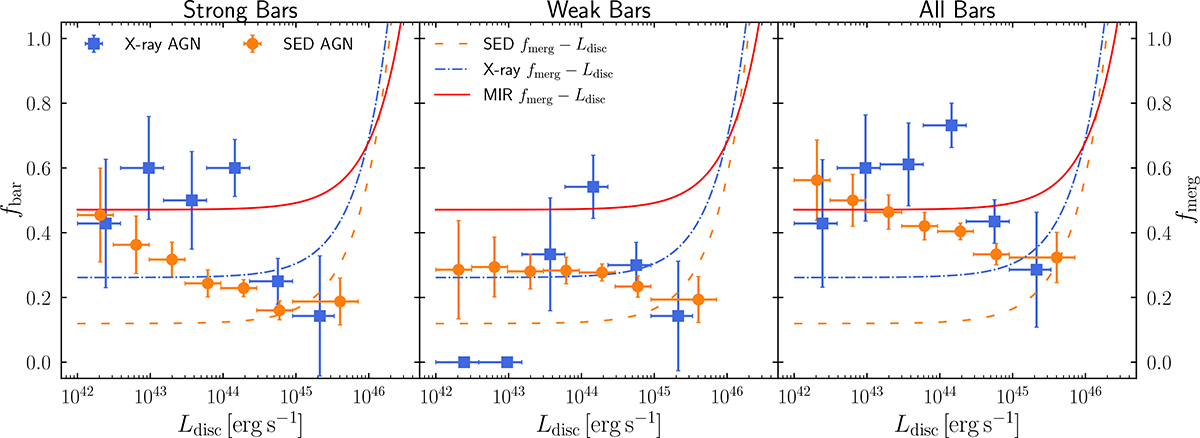
Fig. 15.
Download original image
Bar fraction as a function of the AGN total disc accretion luminosity (Ldisc) for X-ray (blue lines) and SED (orange circles) AGN. The fbar is calculated for the Sbar and Wbar individually (left and middle panels, respectively), and for the total Abar sample (right panel). The error bars are the same as in Fig. 13. Overlaid are the best-fit fmerg–Ldisc relations from LM24 for the MIR (solid red line), X-ray (dotted-dashed blue line), and SED (dashed orange line) AGN, parametrised as described in Appendix C.
Current usage metrics show cumulative count of Article Views (full-text article views including HTML views, PDF and ePub downloads, according to the available data) and Abstracts Views on Vision4Press platform.
Data correspond to usage on the plateform after 2015. The current usage metrics is available 48-96 hours after online publication and is updated daily on week days.
Initial download of the metrics may take a while.