Fig. 5.
Download original image
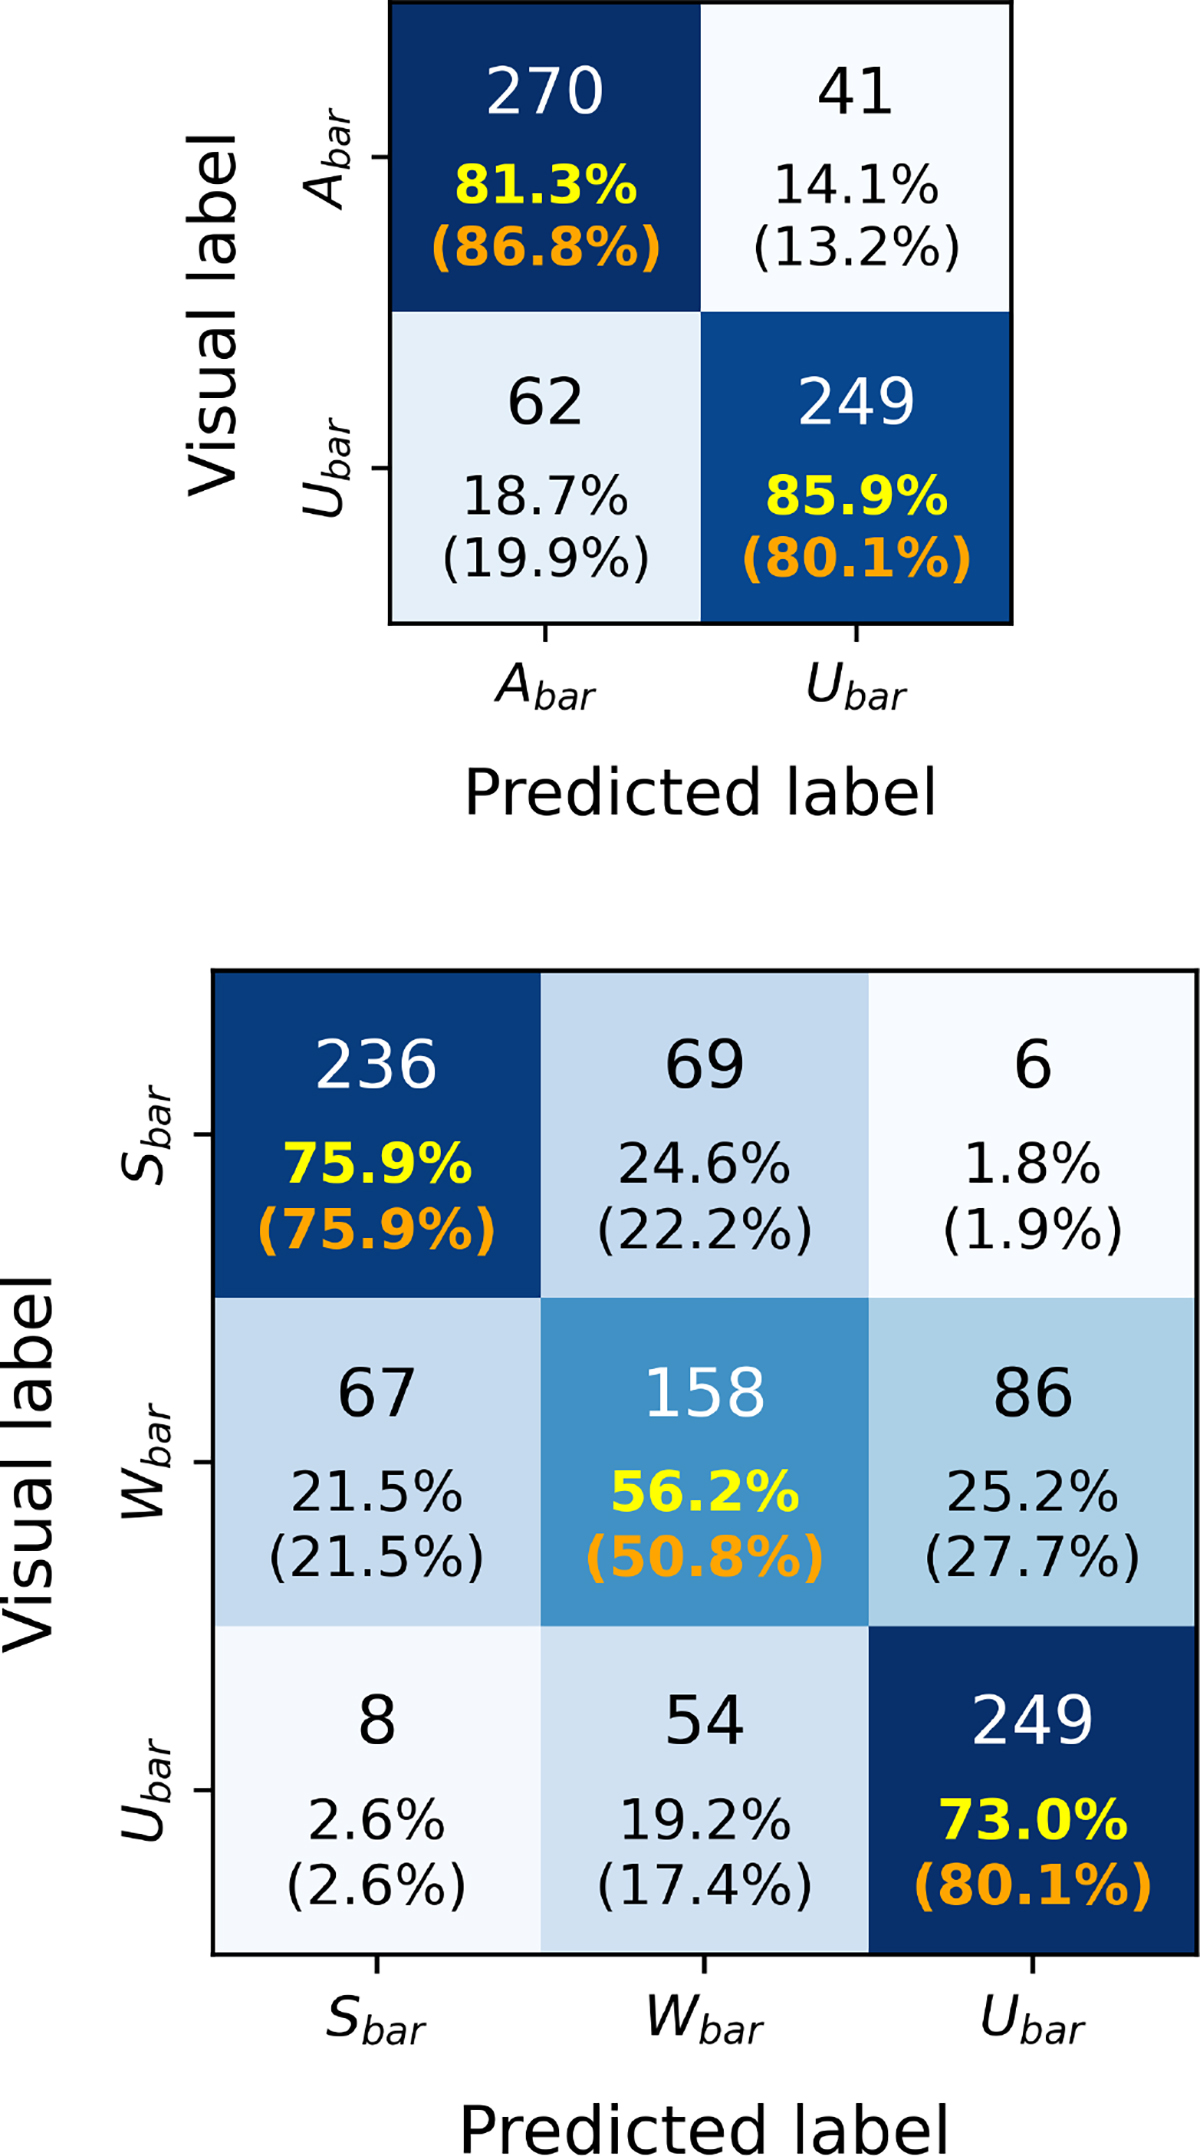
Confusion matrices for the sample selected using the criteria in Sect. 3.1.2, colour-coded by the total number of galaxies in each row. The content of each cell is the same as in Fig. 4. Top: Confusion matrix considering all bars as a single class (Abar). We selected the same number of Abar and Ubar examples. Lower: Confusion matrix dividing the bars into Sbar and Wbar.
Current usage metrics show cumulative count of Article Views (full-text article views including HTML views, PDF and ePub downloads, according to the available data) and Abstracts Views on Vision4Press platform.
Data correspond to usage on the plateform after 2015. The current usage metrics is available 48-96 hours after online publication and is updated daily on week days.
Initial download of the metrics may take a while.