Fig. 10.
Download original image
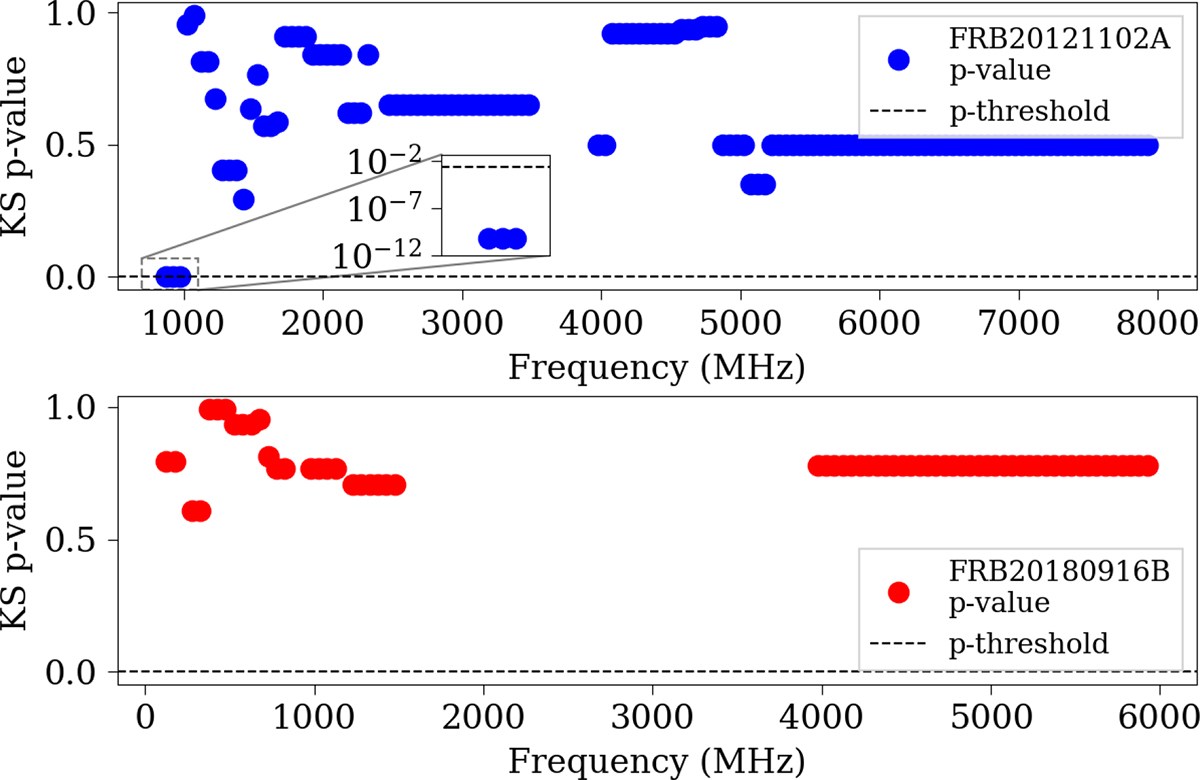
p values of KS goodness-of-fit tests comparing Von Mises cumulative distribution function (CDF) models to the empirical phase CDFs, shown for each frequency bin of FRB 20121102A (top) and FRB 20180916B (bottom). For each frequency bin, the p value quantifies whether the observed burst phase distribution is consistent with a Von Mises model. The dashed horizontal line marks the 3σ rejection threshold (p = 2.7 × 10⁻³); values below this line indicate that the Von Mises model is statistically rejected. The inset highlights the p values in the lowest-frequency bins for FRB 20121102A.
Current usage metrics show cumulative count of Article Views (full-text article views including HTML views, PDF and ePub downloads, according to the available data) and Abstracts Views on Vision4Press platform.
Data correspond to usage on the plateform after 2015. The current usage metrics is available 48-96 hours after online publication and is updated daily on week days.
Initial download of the metrics may take a while.