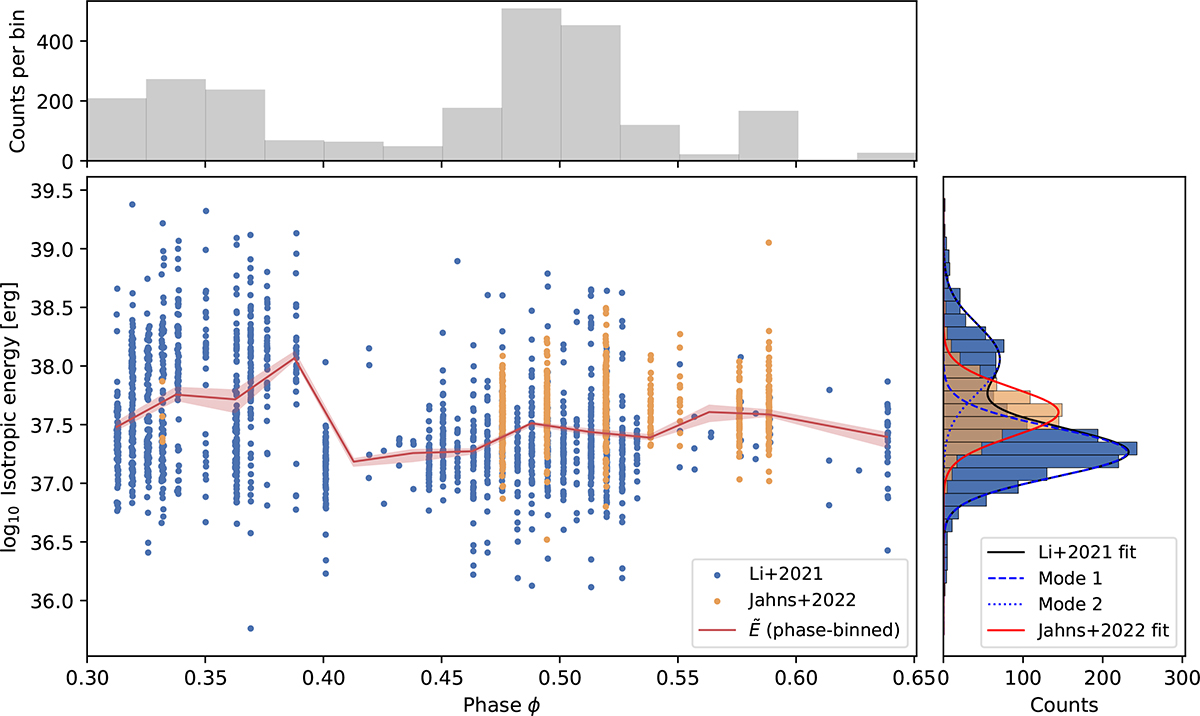
Fig. 11.
Download original image
Phase–resolved burst energetics of FRB 20121102A. The central panel shows the isotropic burst energy as a function of activity phase for the Li et al. (2021) and Jahns et al. (2023) samples. The solid red curve traces the phase-binned median energy, with the shaded region indicating the 1σ bootstrap uncertainty based on 10 000 resamples. The top panel shows the total number of bursts per phase bin. The burst phases were computed assuming a 159.3-day activity period, with a reference epoch MJDref = 58356.5 corresponding to ϕref = 0 (Braga et al. 2025). The right panel displays the marginal energy distributions for the two samples; the Li et al. (2021) sample is described by a bimodal Gaussian with peaks at E ≃ 1.8 × 1037 (dashed blue curve) and 1.2 × 1038 erg (dotted blue curve), while the Jahns et al. (2023) sample is consistent with a single Gaussian peaking at E ≃ 4.0 × 1037 erg (red curve).
Current usage metrics show cumulative count of Article Views (full-text article views including HTML views, PDF and ePub downloads, according to the available data) and Abstracts Views on Vision4Press platform.
Data correspond to usage on the plateform after 2015. The current usage metrics is available 48-96 hours after online publication and is updated daily on week days.
Initial download of the metrics may take a while.