Fig. 8.
Download original image
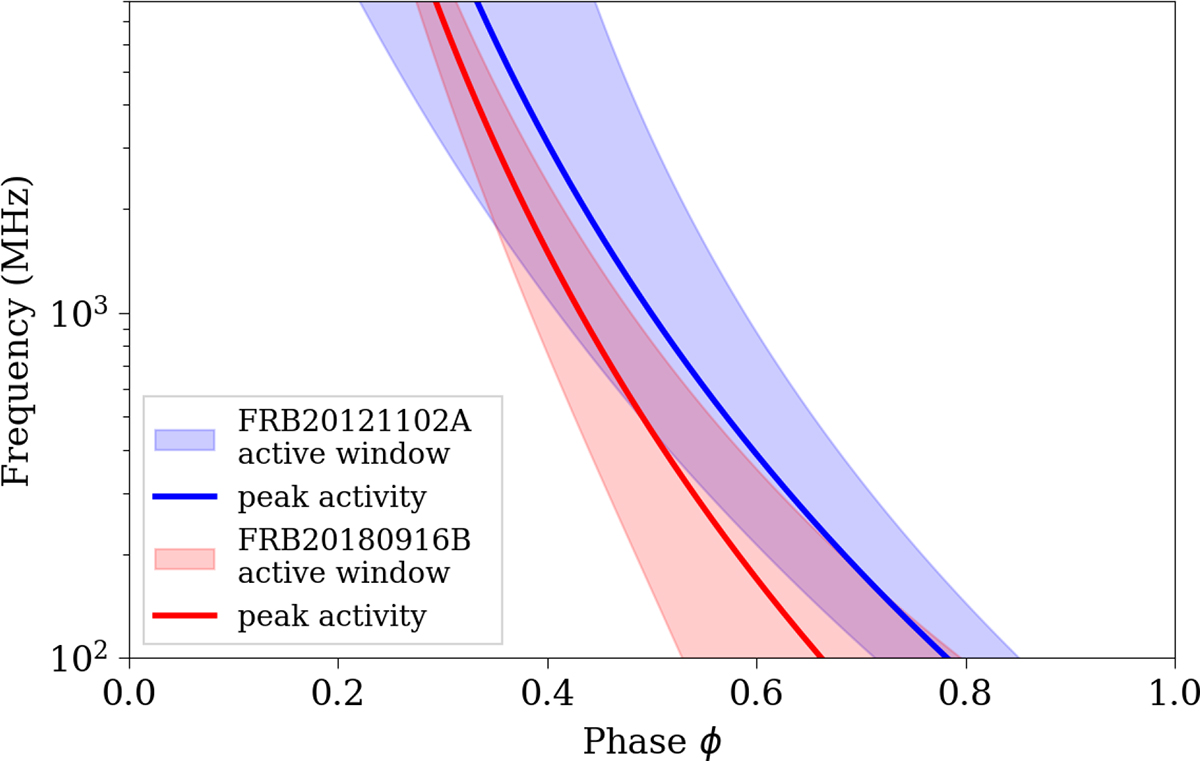
Comparison of the chromatic activity windows for FRB 20121102A (red) and FRB 20180916B (blue). The solid lines represent the power-law fits to the peak phases of each FRB activity window. For FRB 20121102A, the fit is characterised by Aμ = −0.195 ± 0.073 and Bμ = 0.470 ± 0.024 (red line), and for FRB 20180916B, the fit is given by Aμ = −0.186 ± 0.018 and Bμ = 0.475 ± 0.006 (blue line). The shaded regions represent the FWHM of the active windows.
Current usage metrics show cumulative count of Article Views (full-text article views including HTML views, PDF and ePub downloads, according to the available data) and Abstracts Views on Vision4Press platform.
Data correspond to usage on the plateform after 2015. The current usage metrics is available 48-96 hours after online publication and is updated daily on week days.
Initial download of the metrics may take a while.