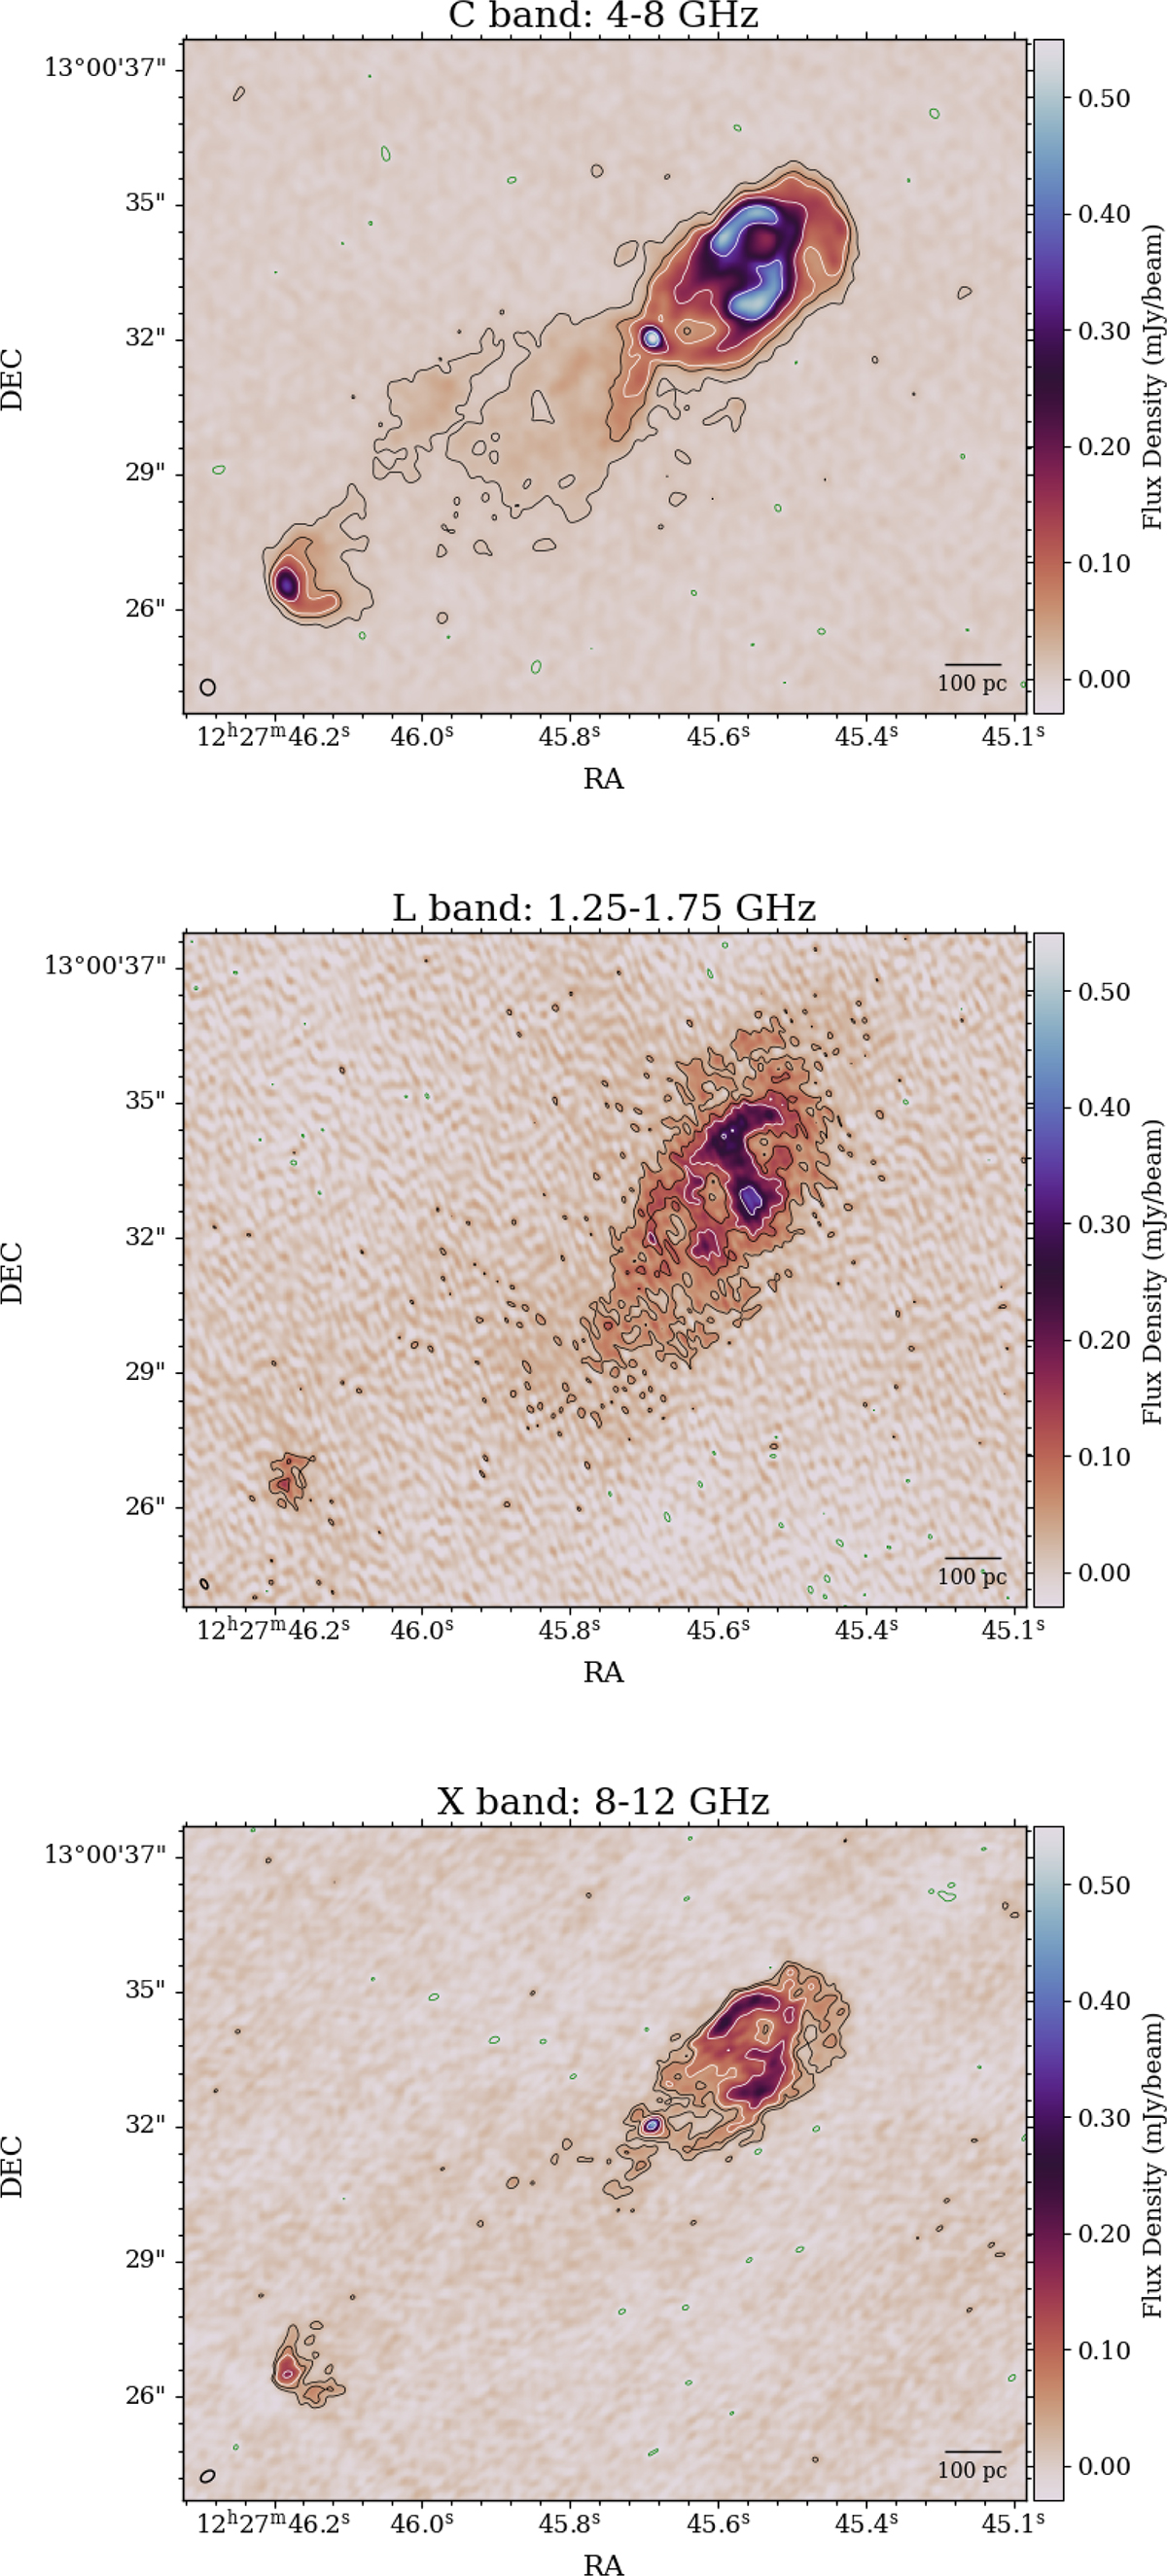
Fig. 1.
Download original image
NGC 4438 radio structures. Top: C-band image from VLA data. Centre: L-band image from blending e-MERLIN and VLA data. Bottom: X-band image with VLA data. Contours: We represent the −3σ regions in green, the two black contours represent 3σ and 0.05 mJy, and the three white ones 0.075 mJy, 0.15 mJy, and 0.35 mJy. The ellipse in the bottom left indicates the restoring beam. Despite the similar resolution in the C- and X-band images, the diffuse emission captured in the C band makes the image appear smoother. This is an intrinsic effect limited by wavelength.
Current usage metrics show cumulative count of Article Views (full-text article views including HTML views, PDF and ePub downloads, according to the available data) and Abstracts Views on Vision4Press platform.
Data correspond to usage on the plateform after 2015. The current usage metrics is available 48-96 hours after online publication and is updated daily on week days.
Initial download of the metrics may take a while.