| Issue |
A&A
Volume 707, March 2026
|
|
|---|---|---|
| Article Number | A319 | |
| Number of page(s) | 16 | |
| Section | Extragalactic astronomy | |
| DOI | https://doi.org/10.1051/0004-6361/202556289 | |
| Published online | 13 March 2026 | |
A multi-wavelength approach to AGNs feedback in low ionisation nuclear emission-line regions: The case of NGC 4438
1
Instituto de Astrofísica de Andalucía – CSIC, Glorieta de la Astronomía s/n, 18008 Granada, Spain
2
Instituto de Radioastronomía y Astrofísica (IRyA), Universidad Nacional Autónoma de México, Antigua Carretera a Pátzcuaro #8701, Ex-Hda. San José de la Huerta, 58431 Morelia, Michoacán, Mexico
3
Centro de Astrobiología (CAB) CSIC-INTA, Camino Bajo del Castillo s/n, 28692 Villanueva de la Cañada, Madrid, Spain
4
Jodrell Bank Centre for Astrophysics, School of Physics and Astronomy, The University of Manchester, Alan Turing Building, Oxford Road, Manchester M13 9PL, UK
★ Corresponding author: This email address is being protected from spambots. You need JavaScript enabled to view it.
Received:
7
July
2025
Accepted:
18
January
2026
Abstract
Context. The outflows generated by active galactic nuclei (AGNs) may play a crucial role in galaxy evolution. In order to better understand how the feedback from AGNs works, multi-wavelength studies, including of low-luminosity AGNs (LLAGNs), are required. In particular, the presence of multi-phase outflows in low ionisation nuclear emission-line regions (LINERs) has been confirmed to be frequent but the mechanisms that launch them are still being studied.
Aims. We aim to explore the connections between the ionised gas outflow, radio continuum structures, and X-ray emission detected in the LINER NGC 4438. We sought morphological and energetic evidence of jet-mode feedback to reveal how a jet may modify the ionised gas structure and determine whether the ionised gas outflow can be driven by the jet.
Methods. We analysed L-, C-, and X-band images (from 1.4 to 12 GHz) of the LINER NGC 4438, and combined high-resolution data from the enhanced Multi Element Radio Linked Interferometer Network (e-MERLIN) and Karl G Jansky Very Large Array (VLA). We produced radio flux and spectral index maps from which we characterised the source. In particular, we created an energetic model that allows us to estimate the power, age, magnetic field, and the velocity of the particles of the jet. We incorporated optical integral field spectroscopy (IFS) data (GTC/MEGARA) and Chandra X-ray data, with comparable resolution, to better trace the outflow, the AGN, and their potential connection.
Results. We present new L-, C-, and X-band high-resolution, high-sensitivity radio images and spectral-index maps that probe ∼25 pc scales in NGC 4438. These data reveal a close morphological correspondence between the radio structures and the ionised gas bubble. Using a spatially resolved energetic model based on radio flux and spectral index, we disentangle the compact AGN emission from the extended bubble for the first time, establishing distinct physical origins for each structure. We measure a kinetic power of ∼5 × 1044 erg s−1 for the radio bubble, which exceeds the power of the ionised outflow by more than three orders of magnitude.
Conclusions. Our multi-wavelength analysis indicates that NGC 4438 is undergoing jet-mode feedback, where a low-luminosity, weakly collimated jet impacts the dense northern interstellar medium. This interaction drives shock-ionised gas, produces a moderate-velocity outflow that removes material from the region, and generates thermal X-ray emission coincident with the radio and Hα cavity.
Key words: galaxies: active / galaxies: evolution / galaxies: jets / galaxies: nuclei / radio continuum: galaxies
© The Authors 2026
 Open Access article, published by EDP Sciences, under the terms of the Creative Commons Attribution License (https://creativecommons.org/licenses/by/4.0), which permits unrestricted use, distribution, and reproduction in any medium, provided the original work is properly cited.
This article is published in open access under the Subscribe to Open model. This email address is being protected from spambots. You need JavaScript enabled to view it. to support open access publication.
1. Introduction
Low ionisation nuclear emission-line regions (LINERs) represent the most numerous active galactic nucleus (AGN) population in the local Universe (Heckman 1980; Ho 2008; González-Martín et al. 2006, 2009; Márquez et al. 2017). Their lack of strong star formation (SF) makes them a promising opportunity to study AGN feedback, in particular in their relative innermost regions. Winds involving gas at different phases and temperatures are detected arising from these regions. We refer to them as multi-phase outflows, considering their multi-wavelength nature – ionised, neutral, atomic, or molecular gas – and the interplay between all the phases (Cicone et al. 2014; Fluetsch et al. 2021). Hermosa Muñoz et al. (2022) confirm the frequency of multi-phase outflows in LINERs by combining morphological and kinematic criteria (see below). They find hints of outflows in at least one out of every three nearby LINERs in their Hα atlas, which is composed of 70 sources. However, the mechanism that launches and drives outflows in radiatively inefficient systems with low Eddington ratios, such as LINERs, is still under investigation. The ‘kinetic or jet-mode’ postulated by Fabian (2012) appears as a plausible alternative to explain the feedback in these systems, where accretion discs in the form of advection-dominated accretion flows (ADAF) may be responsible for compact nuclear radio emission and jets (Narayan et al. 1998; Fernández-Ontiveros et al. 2023). Jets are defined as highly collimated outflows of plasma launched from compact objects, namely AGNs (Blandford et al. 2019). This material, ejected from an accreting supermassive black hole (SMBH), emits synchrotron radiation and photons that are up-scattered to higher energies via Compton scattering (Panessa et al. 2019). The fraction of jets found in local, low-luminosity radio-quiet AGN, particularly in LINERs, is higher than in more powerful quasars (Panessa et al. 2019; Baldi et al. 2018). Thus, the commonly observed radio jets in LINERs appear as potential power sources for their outflows. Indeed, the possible relation between the jets and the outflows is suggested in other low-luminosity AGNs (LLAGN) such as the LINER NGC 1052 (Cazzoli et al. 2022) or the Seyferts NGC 1125 (Schönell et al. 2025) and NGC 5972 (Ali et al. 2025). To investigate whether the radio jet can be responsible for driving the observed outflow, we propose a morphological and energetic study focused on the connection of the ionised gas outflow phase and the radio continuum emission. For that purpose, an in-depth radio analysis with high-sensitivity and high-resolution data is essential.
In this paper, we focus on the LINER NGC 4438, which is a highly inclined spiral galaxy located near the centre of the Virgo cluster (d = 17 Mpc; Vollmer et al. 2005). Among Virgo galaxies, NGC 4438 stands out as the most perturbed, showing a complex morphology that is associated with a high-velocity interstellar medium (ISM) collision with NGC 4435 and interaction with the dense intracluster medium in the Virgo core (see e.g. Keel 1983; Combes et al. 1988; Kenney et al. 1995; Machacek et al. 2004). Several works in the literature agree on low SF in the inner parts of the galaxy (see e.g. Vollmer et al. 2012; Mahajan et al. 2019), which is composed of an old population with no significant contribution from any recent starbursts (region 4 in Boselli et al. 2005). In Mahajan et al. (2019), they report a total star formation rate (SFR) for NGC 4438 of ∼0.50 M⊙ yr−1, which accounts for the whole galaxy. In the nuclear region, Hota et al. (2007) and Kenney & Yale (2002) give a modest SFR of ∼0.05 − 0.1 M⊙ yr−1. Neither the detected radio emission nor the ionised gas outflow can be explained by the energy coming from SF alone. Optical spectroscopic studies classify NGC 4438 as a LINER (Stauffer 1982; Keel 1983; Heckman et al. 1983; Cazzoli et al. 2018; Hermosa Muñoz et al. 2022). The AGN nature is suggested by a broad Hαλ 6563 Å emission in the nucleus (Ho et al. 1997; Cazzoli et al. 2018) and confirmed via X-rays as a compact source at hard X-rays (González-Martín et al. 2009; Li et al. 2022). The location of its core was somewhat ambiguous, partly due to a dust band that obscures the central region (Kenney & Yale 2002). The asymmetric morphology of this galaxy, which extends westwards on both large scales and nuclear regions, makes it an appealing target for multi-wavelength and multi-scale studies. At radio frequencies, Hummel et al. (1983) pointed to an elongated extended feature with two distinct components orientated along the minor axis of the galaxy. Hummel & Saikia (1991) also reported this structure and highlighted the asymmetry between the two blobs. They could not distinguish the nucleus and instead suggested that its location resides within the main radio structure. Among the extended double-lobe structures, Hota et al. (2007) showed a compact radio source with a flatter spectrum that was proposed to be the core. From their Karl G Jansky Very Large Array (VLA) observations, they also showed an L-C band spectral index map and energetic model. Since they both have a resolution of 1.5 arcsec, the substructures are blended so they cannot be analysed separately.
Masegosa et al. (2011) proposed that the Hα bubble emerging from the nucleus, identified in Hubble Space Telescope (HST) images, is an ionised gas outflow, based on their morphological analysis. Hermosa Muñoz et al. (2024) confirm this by kinematic analysis using integral field spectroscopy (IFS) data from MEGARA/GTC1. ‘Baldwin, Phillips & Terlevich’ (BPT) diagrams (Baldwin et al. 1981) diagrams confirm that the ionisation of the outflow gas does not originate from SF (Lu et al. 2025); rather, it would result from AGNs or shocks, which is consistent with its LINER nature (see Márquez et al. 2017; Cazzoli et al. 2018). The ionised gas outflow detected (Masegosa et al. 2011) is co-spatial with the radio continuum emission (Hota et al. 2007) and Chandra X-rays (González-Martín et al. 2009).
Our current study is focused on the central kiloparsec (∼12 arcsec) of NGC 4438, at sub-arcsecond resolution across the spectrum. It aims to unveil how the central features observed at different wavelengths around the AGN are connected, thus providing insights into how feedback works. In particular, we are interested in understanding the eventual connection between the ionised gas outflows and radio jets. We propose a multi-wavelength approach considering optical imaging and spectroscopy, radio data, and X-ray observations. This methodology requires high-resolution and sensitive data at the different wavelengths, not only for a morphological comparison but also for an energetic analysis. Achieving sub-arcsecond spectral index (α) maps enables us to generate high-resolution models (see Sect. 4). This makes it possible to analyse the substructures (∼25 pc scale) of the central kiloparsec of the galaxy individually for the first time.
This paper is structured as follows. Section 2 provides the details of the data analysed in the paper. In Sects. 3 and 4, we give a comprehensive explanation of the data reduction and the basis of the theoretical analysis used to reach our results. In Sect. 5 we show the main results of the radio data analysis: flux images, spectral index maps, and minimum energy parameters maps. We discuss the impact of radio jets on the host galaxy and their capability to drive ionised gas outflows in Sect. 6. In the same section, we present a possible multi-wavelength interpretation to explain the feedback from the galaxy. Finally, Sect. 7 summarises the main conclusions.
2. Data
For the multi-wavelength approach, we imaged and analysed high-resolution radio data from e-MERLIN2 (L band) and VLA (L, C and X band). We also imaged X-ray data from Chandra, between 0.5 and 10 keV. See Table 1.
Observing log of the data analysed in this paper.
2.1. e-MERLIN data
NGC 4438 was observed with e-MERLIN (project ID: CY16021, PI: Puig-Subirà). The observation consists of two epochs on 2022 August 19 and 20 with a duration of 12.95 and 15.16 hours, respectively. The Lovell telescope was not included in this run, so the number of antennas in operation was 6, providing baselines from 11 km to 217 km. It is an L-band observation centred at frequency of 1.5 GHz with a bandwidth of 512 MHz. The total bandwidth was divided into eight spectral windows each containing 128 channels. It was scheduled as a phase-referenced observation, where on-source scans lasted 7 min and were interleaved with 3 min scans of the phase calibrator, J1230+1223 (J2000 RA: 12:30:49.42 Dec: +12.23.28.04, separation 0.97°, flux peak ∼2.8 Jy). The other calibrators involved in the observation were 1331+3030 (flux calibrator), 0319+4130 (check source) and 1407+2827 (bandpass calibrator). By blending these data with L-band data from VLA, we can create an image that takes into account the compact (e-MERLIN) and the extended (VLA) emission (see Table 3).
2.2. VLA data
For this study, we used data from the VLA archive. We reduced and analysed three datasets involving L-, C-, and X-band data, whose main parameters can be found in Table 1. In this section we describe chronologically each set. We pursue VLA data at maximum resolution, so A-configuration3 at L, C and X bands is the most appropriate option.
In 1986, before the VLA expansion, NGC 4438 was observed in the L band (1.44−1.54 GHz) within the project AH230 (PI: E. Hummel), and later analysed in Hota et al. (2007). The bandwidth is 100 MHz, divided into two 50 MHz spectral windows (1.44−1.54 GHz). The on-source observations consist of 9 scans of 24 minutes each one. J1252+119 is the phase calibrator (B1950 RA: 12:52:07.71 Dec: +11.57.20.82, separation 6.7°, flux peak ∼0.98 Jy), 3C48 and 3C138 are the flux calibrators and 3C286 is the bandpass calibrator. We re-reduced this dataset using them to complement the higher resolution data (e-MERLIN proprietary data), with the objective of adding extended structures. The project AH230 also provides C-band observations not included in this work, since the current data analysed (22A-180, see details below) represent a significant improvement in terms of sensitivity, resolution and bandwidth.
As part of the 22A-180 project (PI: Jiangtao Li), C-band (4−8 GHz) observations were carried out on 2022 June 17, using the VLA-A configuration. The total bandwidth is covered by 32 spectral windows of 128 MHz. In total, 2.30 hours of phase-referenced observations were performed, including 1.10 hours on NGC 4438. It consists of eight scans of 9 minutes each interleaved with observations of J1254+1141, the phase calibrator (J2000 RA: 12:54:38.25 Dec: 11:41:05.87, separation 6.7°, flux peak ∼0.8 Jy beam−1). 3C286 was used both as flux and bandpass calibrator.
We also use X-band proprietary data observed in December 2024 under VLA-A configuration project 24B-323 (PI: Puig-Subirà, M.). The observation consists of 2 scans of 339 seconds on source, using J1239+0730 as phase calibrator (J2000 RA: 12:39:24.58 Dec: +07.30.17.18, separation 6.2°, flux peak ∼0.4 Jy beam−1) and 3C147 as flux/bandpass calibrators. The aggregate bandwidth is 4.05 GHz, (from 7.98 to 12.03 GHz), split in 32 spectral windows of 128 MHz each.
2.3. Chandra data
NGC 4438 was first observed by Chandra (P.I. Christine Jones, ObsID 2883, date: 2002-01-29) in a single exposure of 25.4 ks (net exposure after flares removal is 25.1 ks) to study the effect of the environment in the galaxies NGC 4435 and NGC 4438 within the Virgo Cluster (Machacek et al. 2004). It was then observed four times (P.I. Jiang-Tao Li, ObsIDs 21376, 23189, 23037, and 23200, between 2020-03-20 and 2020-03-28) with a total exposure time of 96 ks (net exposure of 94.5 ks) to study the X-ray nuclear bubble (Li et al. 2022). Although it also appears in the snapshot observation with ObsID 4960 (5 ks), the above five observations are the only ones with enough counts (> 500 counts) to be used in this analysis.
3. Data reduction
In the following sections, we provide a comprehensive explanation of the reduction and analysis processes. We provide details of the different steps to ensure reproducibility of the data processing.
We first calibrated the radio data by the pipelines of the instruments, wherever possible (see next subsections). Then we self-calibrated each dataset (See Table 2) and imaged them using CASA. For X-ray data, we used CXC Chandra Interactive Analysis of Observations (CIAO) software4 and the calibration database CALDB to calibrate, reprocess and image the data.
Self-calibration and imaging parameters.
3.1. e-MERLIN data (L band)
We calibrated the data with the e-MERLIN CASA pipeline version: v1.1.08 (Moldon 2021) using CASA version 5.5.0. We processed each epoch individually. The first automatic flagging was in strict mode, so two spectral windows and one antenna were completely flagged. To avoid this, we dug into the pipeline modifying the flags file, some parameters (‘applymode’ from ‘calflagstrict’ to ‘calflag’, minbl = 2 and minsr = 1) and also the averaging times. For amplitude and phase calibrations we reduced the solution interval from 32 seconds to 8 seconds and for the delay calibration (K1) from 180 seconds to 32 seconds. Throughout this process, the calibration was improved, and we recovered previously flagged data. Once a satisfactory initial calibration (i.e. the pipeline data products) was achieved, we concatenated the two measurement sets (see Sect. 2.1) and started the self-calibration.
The phase calibrator (J1230+1223) is slightly resolved source at 2.89 Jy. In order to recover the extended emission in the model, we first self-calibrated the phase calibrator and then we applied the improved model to the sources. This first self-calibration was divided into four steps: two phase mode calibrations and two amplitude and phase calibrations. The interval time for each round is inf, 120 s 60 s, 9 s and the S/N threshold we imposed was 3.
We then applied the generated tables both to the phase calibrator and to the target. With this improved model in the data, we started self-calibrating the target. Due to the low brightness of our target, we only carry out one round of self-calibration in phase, combining all the spectral windows with an interval time solution of 420 s. To image and generate the model we used CASA task TCLEAN with cell size of 0.025 arcsec.
The long baseline of e-MERLIN and the capabilities of the VLA allow us to capture both the compact and diffuse emission in NGC 4438. Furthermore, note that the e-MERLIN shortest baseline (∼10−15 km) is similar to the baseline lengths as VLA A array, thus provide deeper images with good imaging fidelity on a wider range of scales5. Therefore, once the e-MERLIN dataset was calibrated, we combined it with L-band VLA data (see the calibration parameters in Sect. 2). We used the task CONCAT to combine the visibilities, weighting the data through STATWT. Then we created the final L-band image (e-MERLIN + VLA) using TCLEAN, with a cell size of 0.02.
3.2. VLA data (L, C and X band)
AH230 project was observed in 1986, so we conducted the calibration manually. We follow the open NRAO tutorial6. First, we conveniently split the observation measurement set file and inspect it with PLOTMS to identify the data that should be flagged. We note that spectral window 1 on antenna VA19 required flagging. After the initial flagging, we started with the calibration, which consist of 5 steps: (1) set the flux density scale (SETJY) providing a flux density value for the amplitude calibrator (3C286) according to the band; (2) generate a calibration table for the gain curve of each antenna depending on zenith-angle (GAINCAL); (3) carry out an initial phase calibration to average the phase variations with time in the bandpass; it moderates the effects of variations from integration-to-integration and from scan-to-scan on the bandpass calibrator; (4) derive corrections for the complex antenna gains; (5) finally, produce the amplitude gain scaling table to determine the system response to a source of known flux density, the flux calibrator (task: FLUXSCALE).
We applied all the generated tables to the target (task: APPLYCAL) and initiated a model by a first imaging (task: TCLEAN). For AH230 data, we performed only one phase self-calibration loop because of the sensitivity. We chose a solution interval of 54 seconds, combining the two spectral windows. The cell size used for the imaging was 0.066 arcsec.
The calibration of the 22A-180 data was performed using the standard VLA CASA pipeline, version: 6.4.17. Once calibrated, we split the target source from the calibrated data without averaging. We imaged the data using the task TCLEAN, selecting a cell size of 0.03 arcsec. The first model was generated in two steps to achieve a good coverage for both compact and extended emission. In other words, we generated a first high resolution image focused on compact structures (smallscalebias = 0.9). Then, we created a second image to add the extend emission contribution to the model. We addressed this by restarting the same model in a second TCLEAN run and modifying some parameters in favour of the extended structures, uvrange = ‘< 300klambda’, smallscalebias = −0.5 and robust = 2.
The self-calibration of NGC 4438 was carried out in three steps: two phase self-calibrations followed by an amplitude and phase calibration. The parameters in the TCLEAN were the same for the three images: cellsize = 0.02, scale = [0, 12, 30]. In the phase self-calibrations, in order to obtain a good S/N, we combined all spectral windows in the first step and groups of 4 spectral windows in the second one. In the amplitude and phase self-calibration each spectral window was treated individually.
For the X-band data from 24B-323, we ran the standard CASA pipeline. The self calibration consisted of three steps, two rounds of phase calibration and one of amplitude and phase. In the first phase self-calibration and the amplitude and phase self-calibration step, each spectral window was treated individually while in the second phase self-calibration we combined all the spectral windows to improve the S/N. We combined the two scans in the amplitude and phase self-calibration step.
3.3. Chandra data
We used HEASARC archive8 to download ObsIDs 2883, 21376, 23189, 23037, and 23200. We then processed these observations using CXC Chandra Interactive Analysis of Observations (CIAO) software9 in its version v4.16 (released in December 2023) and the calibration database CALDB v4.11.5 (also released in December 2023). As in Li et al. (2022), we reprocessed the raw data with the CIAO tool REPRO. We first cleaned the data from background flares (i.e. periods of high background) that could affect our analysis. To clean them, we used the LC_CLEAN.SL task removes periods of anomalously low (or high) count rates from light curves from source-free background regions of the CCD. We then reprojected and combined observations to create a merged event list and exposure-corrected images. We used the image ObsID 21376 as a reference because it has the longest exposure time. We used the tool WAVDETECT to search for sources and computed the transformation to align the images with sources detected within a 2 arcsec radius of the target using the tool WCS_MATCH and WCS_UPDATE. WCS_MATCH compares two sets of source lists from the same sky region and computes the transformation to align one to the other. WCS_UPDATE modifies the header aspect solution based on a transformation matrix. Note that the radius is set to 2 arcsec to optimise the alignment of the nuclear source.
The output of this process is an event file with all photons obtained in the five exposures. We then produced smoothed 0.5−2.0 keV images using the DMCOPY (to choose the 0.5−2.0 keV energy range) and CSMOOTH (to use adaptive smoothing to enhance the extended emission) tasks. This image was constructed by subdividing the default pixel of Chandra (0.492 arcsec/pix) to reach 0.125 arcsec/pix. This is the best spatial resolution that we can achieve considering the total counts obtained (3500 counts in the 0.5−10 keV band).
We also extracted the spectra of several regions of interest from each of the event files to investigate their emission mechanism, and for that purpose, we extracted the spectra of two circles, one for the target and another for the background in a free-source sky region using the DMEXTRACT. We also obtained both ARF and RMF files, using MKWARF and MKACISRMF tools, respectively. Furthermore, we produced binned spectra of each region, with the FTGROUPPHA tool, using the optimal binning scheme.
4. Estimation of the radio emission parameters
We used C-band VLA data (22A-180), which offer wide bands (4−8 GHz) and high-resolution (∼0.3 arcsec2), to perform a reliable analysis of radio emission at ∼25 pc scales. Indeed, the location of the non-thermal radio jet and its energetic characterisation help us to describe feedback mechanisms. In this section we detail a methodology for quantifying the spectral index, α, and modelling the radio emission through producing minimum energy parameters maps.
4.1. Spectral index
The spectral index, α, is defined as Sv ∝ vα (Pacholczyk 1970). Its analysis allow us to identify the nature of the radio emission, separating thermal and non-thermal components.
We computed α across the C band using ASTROPY and CASA tasks. L- and X-band data were not included in this part of the analysis, since their surface brightness sensitivity at the relevant scales is different when using matching uv distances. So, even though the maximum resolution is similar, the recovered emission is not directly comparable. Furthermore, the observations were carried out independently, with different depths and calibrators.
Firstly, we split the dataset into four measurement sets of eight spectral windows of 128 MHz each one. We selected the same uv-range in all of them (16.71 kλ–610.56 kλ) to ensure that we are comparing the same angular scales and we imaged each set with the same parameters. Then we smoothed higher resolution images to the lowest resolution involved (task: IMSMOOTH). The common restoring beam for the four sub-images is 0.42″ × 0.36″ and the rms values are 8.3, 8.8, 11.6, 11.4 μJy beam−1 (from lowest to highest central frequency). The regrid step is not needed because of the homogeneous conditions in the creation of the images. Once we got comparable images, we exported them from CASA images to fits files (task: EXPORTFITS), to analyse them pixel by pixel. We imposed a S/N threshold for each pixel, such that if the ratio between the flux and the standard deviation of the residual image is < 5, that pixel is discarded, to minimise uncertainties. Thus, pixels with a S/N < 5 (3 mJy beam−1 at 5 GHz) in any of the four images, were masked for this analysis. We calculated α by fitting the four values in log-log space following the relation log(Sv)∝α log(ν), using the NUMPY function POLYFIT. The spectral index values per region are presented in Table 4. They were calculated by averaging the spectral index values (per pixel) within a restoring beam area. The errors account for the dispersion of the fit and the uncertainty at each point. We obtain compatible results when using CASA tools directly (i.e. CALCKMASK on IMSTAT tool with mode=’spix’).
4.2. Physical model of the radio emission
We used a parametrisation that models the power (P) and energy (U) of the jet, the cosmic-ray energy density,  , the cosmic ray electron diffusion length, LD, the magnetic field strength, Bmin, and the particle lifetime, tsyn. Our methodology follows an analogous approach to Irwin et al. (1999) applied to NGC 4438 at 1.5 arcsec resolution in Hota et al. (2007). In this work, we present the analysis at ∼0.4 arcsec, enabling the analysis of the substructures separately, in particular enabling us to distinguish the nucleus from the additional structures. The resultant maps are computed pixel by pixel since the luminosity (L) and the spectral index (α) both vary across the galaxy. Note that L = 4πd2Sν requires an integration over frequency which is dependent on spectral index, Sν ∝ να, (Pacholczyk 1970), which results in
 (1)
(1)
The common spectral cut-offs are ν1 = 1 × 10⁷ Hz and ν2 = 1 × 10¹¹ Hz and our reference frequency is ν0 = 4.48 × 10⁹ Hz. We use three inputs to produce these parameter maps: (1) the naturally weighted flux density10 map from which the luminosity is computed, (2) the spectral index map at the appropriate resolution, and (3) a map of the line-of-sight distances, l11.
Following the minimum energy assumption, one can acquire maps of Bmin and  , averaged over a line of sight. These are computed in cgs units (see Pacholczyk 1970; Duric & Crane 1991; Irwin et al. 1999), from
![Mathematical equation: $$ \begin{aligned}&B_{\rm min} = \left[6\pi (1+k)c_{12} V^{-1} L\right]^\frac{2}{7} \end{aligned} $$](/articles/aa/full_html/2026/03/aa56289-25/aa56289-25-eq4.gif) (2)
(2)
 (3)
(3)
where V is the volume (V = r2l, where r is the linear distance subtended by the pixel), and L is the luminosity. The constant c12 is one of Pacholczykys constants, assuming the common cut-offs ν1 = 1 × 10⁷ Hz and ν2 = 1 × 10¹¹ Hz (Irwin et al. 1999; Hota et al. 2007), in CGS units (cm−3/4 g3/4 s−1/2), which, for the convention Sv ∝ vα is defined as
![Mathematical equation: $$ \begin{aligned} c_{12} = 1.06 \times 10^{12} \left(\frac{2\alpha +2}{2\alpha +1}\right) \frac{\left[v_1^{\frac{(1+2\alpha )}{2}} - v_2^{\frac{(1+2\alpha )}{2}}\right]}{\left(v_1^{1+\alpha }-v_2^{1+\alpha }\right)}\cdot \end{aligned} $$](/articles/aa/full_html/2026/03/aa56289-25/aa56289-25-eq6.gif) (4)
(4)
The parameter k is the heavy particle to electron ratio. Its value can range from 1 to 2000 depending of the system and assumptions12. A value of k = 40 is commonly used in the literature coinciding with the value of cosmic rays near the Earth exhibit (Condon & Ransom 2016). Although it does not describe exactly the radio galaxy behaviour, we use k = 40 in order to be able to compare our results with previous studies. We note that this k value affects the absolute scale of the maps but not the point-to-point variations.
We can assume that the relativistic electrons inside the radio lobes lose most of their energy by synchrotron emission. Thus, the tsyn of these particles can be obtained as the synchrotron cooling timescales for cosmic-ray electrons emitting at frequency ν:
 (5)
(5)
We have to consider this value as an upper limit because if other loss mechanisms (e.g. inverse-Compton scattering) are significant, the actual source lifetime will be shortened (Condon & Ransom 2016).
To derive the radio power either of the following two equations can be applied:
 (6)
(6)
where U is  integrated along a line of sight (so
  , for each pixel) and tsyn is the particle lifetime or
 (7)
(7)
In this work we use Eq. (7), where L is the observed luminosity at a given point.
Once calculated the radio power for each pixel (see Sect. 5.5), we determine the value of the jet power depending on the selected region. First, we select a region and sum the total radio power contribution. Then use the relationship between the total radio power and jet power presented in Merloni & Heinz (2007), Eq. (8) in this paper. This equation is suitable for the case of NGC 4438 and has been used in comparable analyses (see Sect. 6.2):
 (8)
(8)
Finally, to obtain the diffusion length, we need to calculate the propagation velocity of the plasma waves. For this, we chose the Alfvén intermediate mode (see also Pacholczyk 1970; Irwin et al. 1999):
![Mathematical equation: $$ \begin{aligned} v_a = \frac{B_{\rm min}}{\sqrt{\mu _0\rho }}\,\mathrm{[SI]} = \frac{B_{\rm min}}{\sqrt{4\pi \rho }}\,\mathrm{[cgs]}, \end{aligned} $$](/articles/aa/full_html/2026/03/aa56289-25/aa56289-25-eq13.gif) (9)
(9)
where va is an order-of-magnitude estimation assuming a constant mean ISM density of 0.18 cm−3, commonly used in the literature (Irwin et al. 1999). Since we assume the medium is ionised, we multiply this density by the proton mass to give it the proper dimensional units. From this point, the diffusion distance (DL), i.e. the distance that an electron travels before it loses its energy, can be calculated as
 (10)
(10)
In Sects. 5.5 and 6.2, the maps produced are described and discussed.
5. Results
In this section we present the C-, L-, and X-band images (Fig. 1) describing the substructures of NGC 4438 (Fig. 2), the C-band spectral index map (Fig. 3), the maps of minimum energy parameters (Fig. 4) previously defined and the X-rays images (Fig. 5). The main information of the C-, L-, and X-band images can be found in Table 3. We analysed the images using IMSTAT and IMFIT tasks for more diffuse (lobes) and more compact (nucleus) regions, respectively.
Parameters of the continuum images in each band.
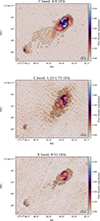 |
Fig. 1. NGC 4438 radio structures. Top: C-band image from VLA data. Centre: L-band image from blending e-MERLIN and VLA data. Bottom: X-band image with VLA data. Contours: We represent the −3σ regions in green, the two black contours represent 3σ and 0.05 mJy, and the three white ones 0.075 mJy, 0.15 mJy, and 0.35 mJy. The ellipse in the bottom left indicates the restoring beam. Despite the similar resolution in the C- and X-band images, the diffuse emission captured in the C band makes the image appear smoother. This is an intrinsic effect limited by wavelength. |
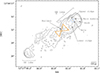 |
Fig. 2. Scheme presenting the substructures of NGC 4438. It is based on the C-band image (see Fig. 1 and Sect. 5.1). The contours are at 3σ, 0.03 mJy, 0.08 mJy, 0.2 mJy, and 0.35 mJy. The orange line shows the hourglass-like structure mentioned in the Sect. 5.1. The NW side of the orange figure encloses the region referred to as the ‘base of the cone’. We name the circular cavity in the main bubble (blue circle) the ‘hole’. |
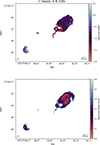 |
Fig. 3. Top: C-band spectral index map created pixel by pixel with a S/N threshold of 5. Bottom: Error in the spectral index value for each pixel. |
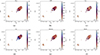 |
Fig. 4. Maps of the minimum energy parameters assuming k = 40. (a) Magnetic field strength (Bmin). (b) Cosmic-ray energy density, |

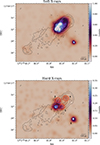 |
Fig. 5. X-ray Chandra images with radio C-band contours. Top: Soft X-rays (0.5−2 keV). Bottom: Hard X-rays (2−10 keV; see Sects. 3.3 and 5.6 for details). Contours: 3σ (black), 0.05 mJy (white), 0.075 mJy (black), 0.15 mJy (white), and 0.35 mJy (black). The 0.35 mJy contour locates the nucleus. In the bottom panel, we indicate the five regions in which we have fitted spectra: (1) Nuclear, (2) North, (3) South, (4) West, and (5) External. |
5.1. C-band image (VLA)
The C-band image (Fig. 1, top) obtained from the VLA-A configuration (22A-180) has a resolution of 0.33″ × 0.30″ and rms of 4 μJy beam−1 (see Sects. 2.2 and 3.2). We identify the nucleus and two asymmetric structures, namely the north-west lobe and the south-east lobe (hereafter NW lobe and SE lobe, respectively). We use the scheme in Fig. 2 as a reference for the different components described below.
– Nucleus: We detect a compact component at RA: 12:27:45.672 Dec: 13.00.31.680, in agreement with the C- and X-band radio images quoted in Hota et al. (2007). It has a total nuclear radio emission of 0.91 mJy. Extended emission arises from the nucleus in the innermost part tracing an hourglass-like structure (orange line in Fig. 2) along the axis of the two lobes. However, the inner partial symmetry is quickly lost and the hourglass shape becomes truncated as it stretches towards each lobe, forming the bubble in the case of the NW direction.
– NW lobe: It is the most characteristic structure because of its bubble-like shape, also visible in the HST image (Fig. 6 and Masegosa et al. 2011). The total extension of the NW lobe taking into account the extended emission contribution is 4.8 arcsec (∼400 pc). We distinguish three substructures within the NW lobe, ordered from the nucleus outward: the base of the cone, the main bubble and the external hook (see Fig. 2). According to the top panel in Fig. 1, we refer as the main bubble to the bluest structure (2.4 arcsec ∼200 pc long). Within the main bubble, we point out the hole, a circular central cavity of 0.3 arcsec. The two most luminous structures that delimit the main bubble are defined as the upper and lower ridges. Other papers use the term ‘shells’ (Hota et al. 2007). The base of the cone is the fainter structure that connects the AGN to the main bubble. It rises from the nucleus to a distance of 1.8 arcsec, until it is dominated by the lower ridge where the main bubble emerges. Finally, in the most north-western side, we can see a more extended hook-shaped structure, that represents the end of the NW lobe. This radio image reveals a clear connection between the lobe and the nucleus, showing how the bubble emerges from it forming an hourglass-like structure. This complements the optical images, where the effect of the dust obscures this central area.
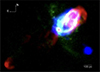 |
Fig. 6. Composite RGB image of NGC 4438 using Hα emission (green), C-band radio emission (red), and X-rays in the 0.5−10 keV energy band (blue). The optical data were taken from the HST archive. The C-band image is the one presented in this paper. The X-ray image is the sum of the two components (hard and soft) shown in Fig. 5. |
– SE lobe: It is situated at 9.5 arcsec (∼730 pc) far from the nucleus. It is smaller and weaker than the NW lobe. In the SE lobe, we glimpse a small arc structure, measuring a flux density of 1.55 mJy, but the majority of the flux is centred in the core of the lobe.
5.2. L-band image (e-MERLIN + VLA)
The L-band image showed in Fig. 1 (middle) is obtained as a result of a combination of VLA (AH230) and e-MERLIN (CY16021) data. The former data provides the extended emission; the resulting image can be found in Hota et al. (2007). The second one allows us to detect the compact structures (see Sects. 2 and 3.1). The L-band image has a resolution of 0.21″ × 0.12″ and a rms of 0.015 mJy beam−1. The substructures of the galaxy may appear less connected due to the stronger contribution of the long baseline set in the e-MERLIN array, compared to the VLA.
– NW lobe: It is still present at lower frequencies. Regarding the main bubble, emission in the upper and lower ridges persists but exhibits different shapes compared to the C-band image. The upper ridge largely retains its structure, while the emission of the lower ridge is concentrated in a central spot, which is the strongest emitting region in this band. The hole is observed in the image as a region with fainter emission. A vertical structure, which may represent the compact structure that would close the main bubble, appears connecting the two ridges. It separates the main bubble and the base of the cone. In this image, the hourglass is not well detected.
– Nucleus and SE lobe: The AGN and the SE lobe are faint in this band but still detected. The Speak of the nucleus is 0.133 mJy beam−1 (8.8σ) and the SE-lobe peak is 0.128 mJy beam−1 (8.5σ).
5.3. X-band image (VLA)
From 24B-323 project VLA-A configuration data, we generated the X-band image (see Sects. 2.2 and 3.2). The resolution of this image is 0.32″ × 0.21″ and the rms is 0.009 mJy beam−1 (Fig. 1, bottom). This image compared to lower frequency images from VLA, resolve out most of the diffuse emission because the longer baselines in units of wavelength filter out large spatial scales.
– Nucleus: In this image, we detect compact emission in the nuclear region, which is the brightest structure in X-band with total emission of 0.57 mJy. Thanks to the new data, we show how the nucleus is connected with the NW lobe, also at these frequencies. In fact, at X-band frequencies, Hota et al. (2007) reported a small jet-like extension (∼0.4 arcsec; 33 pc) at PA of 223°. We also detect this feature but since we recover more emission we see how it is part of the hourglass-like structure.
– NW lobe: At higher frequencies, since our sensitivity to extended emission decreases, we obtain a more abrupt structure that resembles the ‘shell’ described in the literature. The main bubble is detected and the two ridges are well defined. The base of the cone is faded but still present, connecting the nucleus and the main bubble. We can see the internal structure of the hook, that persists at high frequencies.
– SE lobe: We detect the lobe as the arc-like feature mentioned in the C-band description.
5.4. Spectral index map
We show the C-band spectral index map (top) and its error (bottom) in Fig. 3. Section 4.1 gives details of the spectral index calculations and the frequency selection. The values averaged per region can be found in Table 4. The map displays mostly negative values in the whole structure ranging from −2 to 0.5, with errors around 0.1, rising to 0.5 at the boundaries. Pixels with errors greater than 0.5 are not included in the discussion.
In AGN contexts, flat or positive values (α ≥ −0.1) are associated with thermal or free-free emissions, whereas negative spectral indices (α ≤ −0.8) indicate non-thermal emission (Pacholczyk 1970). However, any spatially overlapping contribution from thermal emission would tend to flatten the observed spectral index relative to the intrinsic non-thermal value. To assess if this is happening, we estimate the flux density of radio emission associated with the thermal component (Eq. 6 in Corbelli et al. 2020) from the observed Hα flux. We use an Hα flux of ∼7.68 × 10⁻¹³ ergs cm−2 s−1, which is the sum of the three Hα components in Hermosa Muñoz et al. (2024), covering the field of view of MEGARA (see Sect. 6.3). We assume the electronic temperature of this ionised gas to be 104 K. The calculated flux density in this region due to thermal emissions, at 5 GHz, is 0.75 mJy. By contrast, the measured flux density at this frequency, when considering only the NW-lobe region (i.e. a smaller area), is ∼23 mJy. Therefore, the inferred thermal component would represent at most 3% of the total. This free-free contribution would produce a maximum flattening of Δα ∼ 0.05, below our σ sensitivity of 0.13. Therefore, the measured α = −0.83 ± 0.13 is fully compatible with pure synchrotron emission. To achieve a significant α flattening, beyond the error tolerance, namely α = −0.5, the required thermal flux would be ∼9 mJy, significantly higher than what we observe. Hota et al. (2007) discuss this question used the method described in Lee et al. (2001); they calculated the electron density from the thermal flux required to flatten α, and found it to be much higher than they expected.
The values of α in the NW lobe (see Table 4) are consistent with non-thermal emission. We can distinguish two behaviours, consistently with the previously described structures; in the main bubble the values are between −0.7 and −0.9 (errors around 0.12) compatible with the nature of the jet (α = −0.8, synchrotron emission), while in the base of the cone the values are more negative, with an average of −1.75 (with significant dispersion, i.e. > 0.5, beyond our tolerance range for the forthcoming analysis).
The AGN is clearly identified as a flat-spectrum region (α = 0.07 ± 0.12), due to the superposition of multiple self-absorbed synchrotron components, each with its own spectral turnover, distributed across the observing band (Falcke et al. 2000; Nagar et al. 2002). The nucleus is not particularly absorbed at low frequencies, with values of α close to 0, becoming negative as the distance from the centre increases. The SE lobe also shows negative values (α = −0.44 ± 0.14), compatible with the synchrotron emission but closer to zero than the NW lobe.
5.5. Minimum energy parameters maps
Following the model developed in Sect. 4.2, we obtain the minimum energy parameter maps (namely Bmin,  , tsyn, velocity, DL and power, see Eqs. 1–9), which are presented in Fig. 4. In this analysis we focus on three regions, introduced in Sect. 5.1: the main bubble, the nucleus and the SE lobe. The maximum, minimum and average values for all parameters per region are presented in Table 5. The connection between the AGN and the main bubble (i.e. the base of the cone) and the more extended emission (hook) are not discussed due to the large uncertainty in the spectral index, likely resulting from the low S/N in the highest-frequency sub-bands of the C band.
In the Bmin and  maps (panels a and b in Fig. 4) we observe the three structures with smooth internal variations. Both the nucleus and the SE lobe show lower values compared to the NW lobe. The maximum of Bmin and
  within the main bubble coincides with the minimal flux density, where the hole is located. When we analyse tsyn and DL maps (panels c and d in Fig. 4) we see they are less homogeneous and present tendencies. In the tsyn map we add a contour at 1.3 Myr to highlight the special behaviour in the main bubble, which is younger than the base of the cone. Consequently we note a co-spatial behaviour in the DL map, around values of 1000 pc.
We calculate the particle velocity required to reach each position if the relativistic particles were supplied by the radio nucleus, using the positions and the tsyn of the particles. We choose three locations in the NW lobe: the farthest part of the bubble (hook), the hole and the region of the main bubble closest to the AGN. The distances from the nucleus to this regions are 304 pc, 259 pc and 165 pc, respectively. Then the required velocities, calculated according to tsyn, are 330 km s−1, 147 km s−1 and 165 km s−1. The distance to the SE lobe is 750 pc and the minimum velocity required is 1435 km s−1. These are lower limits, as we are not correcting the velocity component from possible projection effects. In all cases, v ≪ c, so in situ acceleration for dragging the gas to their positions is not required. If we compare these calculations with the velocity map (panel e, Fig. 4) computed assuming the Alfvén mode approximation, the values in the NW lobe are in the range 600−700 km s−1, but in the SE they are lower, around 300−400 km s−1. That is consistent with electrons losing velocity along their travelling path.
The power of the radio emission (panel f in Fig. 4) shows similar features as the flux. However, they do not match exactly, as the luminosity computation requires an integration over frequency that depends on the spectral index. The highest values are found in the main bubble, with 6.8 × 1039 erg s−1, while the nucleus and the SE lobe have integrated values of 6.7 and 6.6 × 1038 erg s−1, respectively. The total radio power accounting for the three structures is 8.14 × 1039 erg s−1, which is a lower limit to the total power of the source because the extended emission between the nucleus and the SE lobe is not included due to the S/N cut-off. Furthermore, within the NW lobe, only the main bubble is considered, excluding the base of the cone and the outermost regions. We calculate the kinetic (jet) power using Eq. (8). The case of high resolution data for this analysis allows us to distinguish the kinetic power of each substructure. For the main bubble, it is ∼1.46 × 1044 erg s−1. We provide a discussion in Sect. 6.2.
We have calculated the brightness temperature (Tb) following Falcke et al. (2000). We use the peak flux density and resolution for both C- and X-band images, where the maximum emission is in the nucleus. We get Tb of 1.8 × 10² K and 9.1 × 101 K in C and X-band, respectively. These values are several orders lower than 105 K, which is a common threshold used to identify black hole accretion (Condon et al. 1991). Our results of resolution ∼0.3 arcsec do not pose a constraint on the nature of the core, since the scope of this criteria would require microarcsecond resolution for such luminosities.
5.6. X-ray results
The soft X-ray image (Fig. 5, top) reveals an extended morphology (∼4.5 arcsec, i.e., ∼375 pc) that is co-spatial with the NW radio lobe and the outflow traced by Hα emission. The emission reaches the maximum values at the nucleus and the base of the cone, and decreases outwards. The SE lobe can be seen, albeit extremely faintly.
In the hard X-ray image (Fig. 5, bottom), point-like emission is detected in the nucleus, providing direct evidence of the presence of an AGN (González-Martín et al. 2009). We expected to detect only nuclear compact emission, considered as hard emission, but instead we also observe fainter extended emission at the base of the cone and at the hole of the main bubble.
We analyse both soft and hard emission, by fitting their spectra that enable us to interpret the nature of X-ray emission. We extract five regions (see Fig. 5), including the nucleus (region 1), the brightest regions at the hard band within the NW lobe (regions 2, 3, and 4), and an unconnected point-like source towards the south-west of the nuclear region (region 5, RA: 12:27:45.376 Dec: 13.00.28.599). Regions 2 and 3 (north and west, respectively) are selected at the base of the cone, while region 4 is a bright X-ray spot corresponding to a hole in the radio map (see the discussion). For spectral modelling, we use three models. Regions where a power-law (PL) is needed are considered true hard emitter regions with a non-thermal origin. Otherwise, regions where a single MEKAL model is enough to properly adjust the spectra are consistent with thermal emission. We also combine MEKAL and PL to consider the contribution of both thermal and non-thermal emission. The main results of the spectral fit are included in Table 6. PL results are not provided because they give poor fits to all the spectra. Although the MEKAL+PL seem to improve the final fit compared to thermal, its improvement compared to MEKAL model is not significant for any of the sources, except for the nucleus13. Therefore, non-thermal emission is confined only to the nucleus (region 1). Although this analysis is not fully consistent with that published in Li et al. (2022), it is important to remark that they assumed a MEKAL+PL and that our reported values for the temperature are consistent with theirs when MEKAL+PL is assumed, although the regions selected are different. While Li et al. (2022) took slides from the centre towards the outer parts, we have selected specific regions for this work, some of which were on the same slide and may therefore be blurred. Furthermore, we did not adjust the two models (MEKAL+PL) by default in this study; we only added the PL model if it was required for the fit. In any case, the final results are consistent, taking into account the difference in methodology.
This selection allows us to study the base of the cone in particular. The small jet-like extension that we mentioned in Sect. 5.3 and we show how is connected with the NW lobe, commit to the major clues to precents a jet according to Kharb et al. (2010): flatter radio and harder X-ray spectra.
As mentioned above, there is also emission detected at RA: 12:27:45.376 Dec: 13.00.28.599, this is ∼5.1 arcsec (∼420 pc) from the nucleus in the SW direction (external region, 5). This feature does not align with the studied morphology of the galaxy and is not detected in radio wavelengths nor Hα images. We analysed the spectrum of this source, which is consistent with an absorbed power law. Assuming the same distance as that of NGC 4438, we obtain that the X-ray 2−10 keV luminosity of the source is ∼1036 ergs s−1 (photon index Γ = 2.1 ± 0.3 and NH < 0.6 × 1022 cm−2). This luminosity is consistent with being an X-ray binary system. Note that to be compatible with an ULX (i.e. 1039 ergs s−1), the source would have to be at z > 0.004 (inconsistent with being part of NGC 4438). A deep analysis of this source would be necessary to disentangle the origin of this emission, but this is beyond the scope of this work.
6. Discussion
Figure 6 shows a composite RGB image that combines the C-band radio image presented in this work, 0.5−10 keV X-ray Chandra data, and the Hα image from HST, all with comparable spatial resolutions. This co-spatial emission motivates us to look for physical connections between the different frequencies. For this purpose, we complement the morphological analysis with Hα kinematic information (see Fig. 7) from the IFS study with MEGARA/GTC data published in Hermosa Muñoz et al. (2024). In this section we discuss and propose a physical interpretation of our results through a multi-frequency comparison in terms of morphology and energetics.
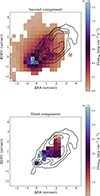 |
Fig. 7. Flux maps of ionised gas (Hα) kinematical components of NGC 4438 with C-band radio contours (0.08 mJy, 0.2 mJy, and 0.35 mJy). The maps show the integrated Hα flux per spaxel of MEGARA, and were provided by Hermosa Muñoz et al. (2024). Both components are related to non-rotational motions (i.e. outflow). Details are given in Hermosa Muñoz et al. (2024). |
6.1. Morphology
In the general framework of AGN, jetted structures are prevalent in LINERs compared to brighter LLAGN, as pointed out by Baldi et al. (2018). The spectral index analysis in Sect. 5.4 shows a flat spectral index in the nucleus, and steep spectral indices consistent with synchrotron emission in the lobes, compatible with a bipolar jet originating from the AGN in NGC 4438. The double-lobe morphology on the kiloparsec-scale of NGC 4438 is detected at different wavelengths (Kenney & Yale 2002; Hota et al. 2007 or Li et al. 2022).
The SE radio lobe appears to propagate to larger distances, suggesting that it is able to escape without resistance through a lower-density channel. Thus, the asymmetry between the two radio lobes is hence most likely due to an asymmetric distribution of interstellar matter in the nuclear region (Hummel & Saikia 1991). The non-detection of X-rays and Hα in the SE lobe, as shown in Fig. 6, supports this hypothesis. We interpret the SE lobe as a receding lobe that appears fainter because of the absorbing material present in this region. Indeed, in HST optical images, we can detect a large amount of dust in the central part of the galaxy. The flatter α in the SE lobe compared to the NW lobe is still consistent with non-thermal emission. It can be related to younger synchrotron emission (consistent with the relative tsyn, Fig. 4), local re-acceleration of relativistic electrons (Carilli et al. 1991) or low-frequency absorption.
Although the nature of the emission strongly suggests that a potential jet may trigger this morphology, it is not collimated. Hota & Saikia (2006) defines radio bubbles as structures whose width is larger than approximately half the size of their length. In this way, they distinguish bubbles from jet-like features and normal lobes, whose axial ratios are usually higher than ∼2. Wiita (1978) suggests that below a critical luminosity, the outflowing plasma forms bubbles, whereas sources above this luminosity tend to form collimated radio jets. Smith et al. (1983) also support the view that bubble formation is more likely to occur in low-luminosity systems. Non-thermal radio bubbles have been observed in other Seyferts (e.g. NGC 1068, NGC 2992, or NGC 5548) and LINERs (NGC 3079 or NGC 3367; Hota & Saikia 2006). According to this criterion, the NW lobe of NGC 4438 aligns with the bubble definition while the SE lobe remains as a lobe.
Multi-wavelength approaches with similar high resolution and high sensitivity data at different frequencies, may shed light on the interpretation of these bubbles. Figure 6 allows us to appreciate the co-spatiality of the emitting features at the three analysed frequencies in the NW lobe. The edges of the Hα bubble, drawn by ionised gas, and the ridges of the main bubble that emits synchrotron radio emission are entirely coincident (see the white regions in Fig. 6). This complex northwestern radio structure observed and the bubble-like shape of the Hα emission suggest a common nuclear power source, as already suggested by Kenney & Yale (2002, see also Masegosa et al. 2011). Often these bubbles show coincident X-ray emission (Croston et al. 2008), as is also the case for the NGC 4438 NW lobe (Fig. 6).
Based on the sample selected by Hota & Saikia (2006), they conclude that the formation of these bubbles is more closely linked to the presence of an AGN than with a starburst process. This scenario is also ruled out in our case due to the lack of an intense starburst in NGC 4438 (Boselli et al. 2005). Instead, the bubble morphology is probably due to the jet interacting strongly with cold, dense material in the galaxy (e.g. Kharb et al. 2010). The co-spatial X-ray thermal emission observed would be also produced by the heating of gas by jet/ISM interaction, resulting in a greater mixing (model IIb in Croston et al. 2008, more likely in clumpy ISM regions). This would resemble the concept of a ‘frustrated jet’ discussed by Gallimore et al. (2006). Both observational studies and simulations indicate that the interaction between the jet and the ISM can cause significant perturbations in galactic morphology and kinematics (Morganti 2017; Cazzoli et al. 2022; Fabbiano et al. 2022; Mukherjee et al. 2018; Perucho 2024; Mukherjee 2025). This impact could trigger the launch of outflows and the expansion or inflation of bubble-like structures (e.g. Murthy et al. 2025 for the LINER NGC 1167).
This hypothesis would result in the formation of Hα shells, produced when cooler gas is compressed by energy injection from the jet. The clear spatial overlap between Hα (green) and radio emission (red) in the NW lobe of NGC 4438 supports the hypothesis that a jet inflates the bubble while ionising the surrounding gas, which remains trapped around it.
X-rays, on the other hand, are found mainly within the bubble, showing hot thermal emission in the NGC 4438 NW lobe, as is the case for NGC 6764 (Kharb et al. 2010). Temperatures found for this bubble (kT ∼ 0.5 keV) are slightly lower than those for the bubble in NGC 6764 (Croston et al. 2008). The reason is most likely that they allow metallicity to vary, finding sub-solar values, whereas we fixed it to solar metallicity. Indeed, although the improvement in the spectral fit is not statistically significant, when solar metallicity is allowed to vary, higher temperatures are also found for the regions studied in this analysis. Li et al. (2022) also use a non-thermal component to characterise the X-ray emission of the NGC 4438 NW lobe. However, a careful analysis of the significance of this component (see Sect. 5.6) shows that it is not statistically needed to explain X-ray emission of this bubble. Therefore, although a minor contribution from non-thermal emission cannot be ruled out, thermal emission dominates the X-ray emission observed in the NGC 4438 NW lobe.
The connection between radio and X-ray emission is naturally explained by jets emerging from AGN that can inject energy into the surrounding hot gas, inflating lobes or bubbles that displace the X-ray-emitting gas (Bîrzan et al. 2004; Fabian 2012). This effect produces the so-called radio-filled X-ray cavities, i.e. depressions in the X-ray surface brightness that are often filled with radio-emitting plasma (e.g. Diehl & Statler 2008). Therefore, the interaction between X-rays and radio emission in the central kiloparsec region is direct evidence of mechanical AGN feedback. In contrast to the X-ray cavities observed in clusters, we observe in the bottom panel in Fig. 5 an apparent central depression (hole) in synchrotron emission at radio maps that coincides spatially with enhanced X-ray emission. This structure may arise when a slightly collimated jet forms a cocoon that surrounds, rather than entirely displaces, the hot gas. It allows thermal plasma to remain or reaccumulate in the central region. This scenario is also compatible with the overall overlap between these emissions and the NW-lobe structure.
Interestingly, in NGC 4438, X-ray emission also extends beyond the ionised shell. While projection effects may contribute, shock-heating of the ISM immediately increases its temperature when the ISM is sufficiently dense and/or inhomogeneous (Gallimore et al. 2006). Thus, the pre-shock gas can be heated directly before the Hα shell forms and X-ray emission could be present beyond it.
A part of the co-spatial emission, NGC 4438 also shows features that do not have a direct link at other wavelengths. In Fig. 6, we show extended Hα emission perpendicular to the axis of the double-lobe morphology, that is not related to the AGN. Instead, it could be ionised gas originating from young stars. Spectroscopic evidence shows the expected rotational motion in the galaxy (Hermosa Muñoz et al. 2024) and non-AGN ionisation hints in this region (Lu et al. 2025). Finally, an X-ray point-like source is seen to the south-west from the nucleus. It is consistent with a non-thermal origin (fitted to an absorbed power-law, see Sect. 5.6), with luminosity consistent with being an X-ray binary system.
6.2. Energetics
We present an energetic model that traces structures at a scale of ∼0.4 arcsec, following the minimum energy assumption (see Sect. 5.5). We obtain maps for different parameters including the Bmin or the tsyn (see Fig. 4 and Table 5). The sub-arcsecond resolution in this analysis allows us to treat each substructure individually. In particular, this enables the AGN to be distinguished from the lobes, which allow us to interpret the physics in the central kiloparsec thoroughly. The total radio power taking into account the three main radio structures (the main bubble, the SE lobe, and the nucleus, see Sect. 5.5) is ∼1.22 × 1040 erg s−1. Our model covers from 4 to 8 GHz, following the model that first proposed Hota et al. (2007). In fact, they provide this model at scales of 1.5 arcsec and at lower frequencies compared to our work, between 1.49 and 4.86 GHz. In general, both models are consistent, but the total radio power reported by Hota et al. (2007) is a few times 1042 erg s−1, two orders of magnitude higher than in this work. Nevertheless, after a revision and recalculation, the total radio power they estimated is 1.7 × 1040 erg s−1 (private communication with Professor J. Irwin and Dr. A. Hota), which is compatible with our result.
The mean values of the energetic parameters (Fig. 4 and Table 4 in this paper, Fig. 3 and Table 3 in Hota et al. 2007) highlight the differences between these two works: (1) the higher resolution of our images, gives us a more accurate and detailed results, (2) the higher sensitivity of our analysis means that when we apply the S/N = 5 cut-off, we avoid regions with higher error, such as the borders and diffuse emission between lobes, that are included in Hota et al. (2007) affecting the mean values.
We calculate the jet power by applying Eq. (8), which relates the radio power and the kinetic power of a radio core. We obtain a jet power between ∼1043 and 1044 erg s−1, depending on the substructures selected (see Sect. 6.3). Comparable LINERs, such as NGC 4374, NGC 4636, or NGC 5846 show jet powers of ∼1042 erg s−1 (Merloni & Heinz 2007). Both NGC 2911 and NGC 1369, which are included in Mezcua & Prieto (2014), exhibit jets extending out to ∼500 pc, resembling those of NGC 4438. Their jet powers are 5.9 × 1042 erg s−1 and 1.5 × 1042 erg s−1, respectively. Even the prototypical LINER NGC 1052, which has an outflow of 8.8 ± 3.5 × 1040 erg s−1 and a 3 kiloparsec jet, does not show such a powerful jet (6 × 1042 erg s−1). Apparently, the jet power of NGC 4438 is higher than that of comparable objects. This is consistent with the high mass outflow rate (1.48 ± 0.99 M⊙ yr−1) found in Hermosa Muñoz et al. (2024).
6.3. Connection between the outflow and the radio bubble
We combine the radio analysis from this study with the kinematical IFS analysis presented by Hermosa Muñoz et al. (2024, see Fig. 7), to discuss the potential connection between the ionised gas outflow and the radio bubble. In Fig. 7, we show the flux maps of the second and third Hα kinematical components (see above) with C-band radio contours overlapped. The spaxels with more flux in the second component trace the NW lobe, showing hints of the conical morphology in the north-west direction. The third component fits perfectly the main bubble location in the NW lobe, corresponding to the more compact radio emission. Both co-locations are consistent with a scenario where the ionised gas and the soft X-ray emission arise in regions where the bubbles of synchrotron-emitting plasma heat and interact with the surrounding ISM.
Hermosa Muñoz et al. (2024) studied the kinematic properties of nine LINERS, including NGC 4438, with IFS data (GTC/MEGARA) in order to explore the extent of their ionised gas outflows. They fitted the emission lines (i.e. Hα, [SII] and [OIII]) using a multi-Gaussian fit decomposition technique and identified ionised gas outflows as a secondary, blue-shifted, broad component, that could not be explained by rotational motions (see also Cazzoli et al. 2018 for details on the fitting procedure). For NGC 4438, they found three components: while the primary component traces the gas disc (rotational motion), the secondary and the third components (Fig. 7) are most likely related to the detected non-rotational motions and the Hα bubble. Hermosa Muñoz et al. (2024) identified an ionised gas outflow extending 307 pc (projected distance) in the north-west direction, with a kinetic power of 9.9 ± 7.9 × 1040 erg s−1, based on the whole second component extension due to its co-spatiality with the Hα bubble seen in HST images (Masegosa et al. 2011). However, Hermosa Muñoz et al. (2024) did not take into account the third component in the physical characterisation of the outflow since they did not find evidence of its origin and outflow relation. In contrast, in Fig. 7 (bottom panel), we show a clear morphological overlap between the third component and the radio emission, not only in the direction but also in the extension up to the main bubble. We evaluated the specific contribution of the third Hα kinematical component to the ionised outflow mass to determine if this kinematical component of Hα could be related and significant to the total ionised outflow mass and energetics. Using the data already published in Hermosa Muñoz et al. (2024), and following the same method, we find this component has a higher electron density (computed from the ratio between the lines of [SII] doublet) and an outflow mass of ∼2.3 × 10⁴ M⊙, one order of magnitude lower than that calculated using the second component. Thus, although we associate the third component with the first jet-ISM interaction, adding the third component contribution to the total power of the outflow does not imply any significant variance. Moreover, we also attempted to mask the nuclear emission; however, the final power that does not show important variations. Overall, we consider the power of the outflow given by Hermosa Muñoz et al. (2024) as the reference value.
The co-spatial radio emission that we have detected is extended out to 400 pc from the nucleus to the hook. The high resolution of our energetic model allows us to discern the potential impact of the different substructures on the kinematics of ionised gas. So far, we have calculated the kinetic (jet) power (Eq. 8) by taking into account the different substructures. Considering the whole radio emission within the second Hα component, so including the nucleus and the entire NW lobe (base of the cone, main bubble and extended hook), the radio power is 3.31 × 1040 erg s−1 and the jet power 5.26 × 1044 erg s−1. If we consider only the nucleus as the radio core with a non-resolved jet, its radio power is 6.7 × 1038 erg s−1 and the mean jet power would be 2.23 × 1043 erg s−1. For the NW lobe without the nucleus, the radio power is 3.24 × 1040 erg s−1 and the jet power 5.17 × 1044 erg s−1. This indicates that the NW-lobe contribution is more significant than the compact AGN contribution, which would account for less than 5%. Nevertheless, the power of a potential nuclear jet would be enough to launch the observed outflow (see above). In the NW lobe, the main bubble represents around 30% of its kinetic power. The base of the cone increases the final value considerably, representing around 70%, but the error in this region could be higher. In any case, based on an energetic analysis and a comparison of outflow and jet powers, we conclude that the jet-driven scenario is fully compatible, regardless of whether the different substructures are combined or treated separately. In this analysis, we note that the outflow definition includes not only the bubble, but also the displaced ionised gas. Anyway, even when the radio emission comes from the very nuclear part, the hypothesis remains consistent; the radio power from the AGN is sufficient to disturb and displace the ionised gas (see Fig. 7). Due to the assumptions made in Sect. 2, the error associated with jet power could be significant. Taking into account only the errors coming from the flux and the spectral index, the error could reach 30%. Note also that, our model dates the oldest structures to be around 2 Myr old, which agrees with the 1.4 Myr that can be derived from the results in Hermosa Muñoz et al. (2024).
NGC 4438 shows similarities with other LINERs and Seyferts, but there is insufficient evidence to establish whether they share the same scenario in terms of feedback mechanisms. NGC 1052, the prototypical LINER, was analysed by Cazzoli et al. (2022). They also identify three kinematical components for NGC 1052 with IFS MUSE data and also suggest that the ionised gas outflow is most likely driven by the radio jet due to its coincident direction and energetic compatibility. In contrast to NGC 4438, NGC 1052 is an isolated elliptical galaxy, and its X-ray and Hα morphologies are relatively symmetric. The Seyfert/LINER spiral galaxy NGC 6764 shows a reported relation between the radio and X-ray bubbles (Croston et al. 2008; Kharb et al. 2010) similar to NGC 4438, although this galaxy has a relevant starburst contribution. Another interesting target is the nearby Seyfert 2, NGC 1068; similar to NGC 4438, it is a galaxy with an asymmetrical double-lobed jet structure and bow shocks (Mutie et al. 2024), similar to the ridges or shells we have referred to in this work. The dense medium in the centre of the galaxy also plays a significant role in its morphology, even causing the jet to change direction (Gallimore et al. 2004; Mutie et al. 2024). Comparing the energies of the molecular outflow (García-Burillo et al. 2014) and the jet also supports the jet-driven scenario in NGC 1068 (Mutie et al. 2024). Despite all the similarities, the collimated jet is much more clearly detected NGC 1068. Moreover, this isolated barred spiral galaxy has a jet oriented along the starburst bar (García-Burillo et al. 2014). In order to better understand LINERs, a systematic multi-frequency study with a significant number of sources is required. It will allow us to draw more comprehensive conclusions and identify trends in this particular type of LLAGNs.
7. Summary and conclusions
This work proposes a multi-wavelength approach to investigate the feedback in a low-accretion, radiatively inefficient AGN, the LINER NGC 4438. The wavelengths involved in the study are the optical (Hα imaging and integral field spectroscopy), radio (data from e-MERLIN and VLA), and Chandra X-ray data. Firstly, we calibrated and imaged the radio (L-, C-, and X-band) and X-ray data. We used the C-band image to compute and analyse the spectral index. We confirm the detection of non-thermal synchrotron emission, which is consistent with the presence of a jet. We then searched for evidence of the jet-mode feedback through the multi-wavelength morphologies and we estimated the energetics of the radio emission. Our main goal was to find out whether the radio jet is powerful enough to drive the ionised gas outflow. We present a model that estimates different parameters such as the age of the structures and their power.
NGC 4438 shows a particular asymmetric central morphology, both in Hα and radio images. We distinguish three main radio structures, namely the NW lobe, the nucleus, and the SE lobe. The kinematical characterisation of the ionised gas outflow of NGC 4438 by Hermosa Muñoz et al. (2024) in their IFS study allows us to compare the energetics of ionised gas outflow with that of radio and X-ray emissions reported in this work. The study presented here leads to the following conclusions:
-
We have analysed the high-resolution radio emission of NGC 4438, which enables us to reach sub-kiloparsec scales. The study reveals the nuclear features and different substructures within the NW lobe. The spectral index analysis shows α ∼ −0.8 in the NW lobe and α ∼ −0.4 in the SE lobe, whereas it is flat for the nucleus (α ∼ 0).
-
The multi-wavelength images presented in this paper show clear connections between emissions, which demonstrates a co-spatial relationship between the ionised gas outflow, the jet, and the X-ray emission.
-
The energetic study at radio frequencies shows a compatibility between the energetics of the ionised outflow and the radio jet. The power of the jet (∼5 × 1044 erg s−1) is about three orders of magnitude bigger than the ionised gas outflow power (9.9 × 1040 erg s−1), so it is consistent with the jet-driven scenario.
-
Thermal emission dominates at X-ray in the NW lobe, although a minor contribution from non-thermal emission cannot be ruled out. We observe how the jet surrounds the hot gas (X-ray), allowing the thermal plasma to remain or reaccumulate in a radio cavity. We only find evidence of non-thermal emission in the nuclear region.
NGC 4438 is the first source that we have analysed, and it provides a pilot for a larger sample. We are pursuing a systematic study by applying this methodology to a sample of 30 LINERs, drawn from the Hα imaging atlas presented in Hermosa Muñoz et al. (2022), for which we have radio, X-ray, and IFU data. The sample is unbiased in terms of both host-galaxy morphology and nuclear radio morphology. Our aim is to evaluate the role of the jet, if present, whether resolved or unresolved, collimated or disrupted. We seek to determine whether jet-mode activity is linked to the observed ionised gas outflows. High-resolution data across different wavelengths are crucial for these studies, such as those provided by VLA or e-MERLIN in radio, or sensitive optical IFS instruments such as MUSE/VLT or MEGARA/GTC.
References
- Ali, A., Sebastian, B., Kakkad, D., et al. 2025, ApJ, 984, 110 [Google Scholar]
- Baldi, R. D., Williams, D. R. A., McHardy, I. M., et al. 2018, MNRAS, 476, 3478 [Google Scholar]
- Baldwin, A., Phillips, M. M., & Terlevich, R. 1981, PASP, 93, 817 [Google Scholar]
- Bîrzan, L., Rafferty, D. A., McNamara, B. R., Wise, M. W., & Nulsen, P. E. J. 2004, ApJ, 607, 800 [Google Scholar]
- Blandford, R., Meier, D., & Readhead, A. 2019, ARA&A, 57, 467 [NASA ADS] [CrossRef] [Google Scholar]
- Boselli, A., Boissier, S., Cortese, L., et al. 2005, ApJ, 623, L13 [Google Scholar]
- Carilli, C. L., Perley, R. A., Dreher, J. W., & Leahy, J. P. 1991, ApJ, 383, 554 [Google Scholar]
- Cazzoli, S., Márquez, I., Masegosa, J., et al. 2018, MNRAS, 480, 1106 [Google Scholar]
- Cazzoli, S., Hermosa Muñoz, L., Márquez, I., et al. 2022, A&A, 664, A135 [NASA ADS] [CrossRef] [EDP Sciences] [Google Scholar]
- Cicone, C., Maiolino, R., Sturm, E., et al. 2014, A&A, 562, A21 [NASA ADS] [CrossRef] [EDP Sciences] [Google Scholar]
- Combes, F., Dupraz, C., Casoli, F., & Pagani, L. 1988, A&A, 203, L9 [Google Scholar]
- Condon, J. J., & Ransom, S. M. 2016, Essential Radio Astronomy (Princeton: Princeton University Press) [Google Scholar]
- Condon, J. J., Huang, Z. P., Yin, Q. F., & Thuan, T. X. 1991, ApJ, 378, 65 [Google Scholar]
- Corbelli, E., Braine, J., & Tabatabaei, F. S. 2020, A&A, 639, A27 [NASA ADS] [CrossRef] [EDP Sciences] [Google Scholar]
- Croston, J. H., Hardcastle, M. J., Kharb, P., Kraft, R. P., & Hota, A. 2008, ApJ, 688, 190 [Google Scholar]
- Diehl, S., & Statler, T. S. 2008, ApJ, 680, 897 [Google Scholar]
- Duric, N., & Crane, P. C. 1991, The Interpretation of Modern Synthesis Observations of Spiral Galaxies (San Francisco: Astronomical Society of the Pacific) [Google Scholar]
- Fabbiano, G., Paggi, A., Morganti, R., et al. 2022, ApJ, 938, 105 [NASA ADS] [CrossRef] [Google Scholar]
- Fabian, A. C. 2012, ARA&A, 50, 455 [Google Scholar]
- Falcke, H., Nagar, N. M., Wilson, A. S., & Ulvestad, J. S. 2000, ApJ, 542, 197 [Google Scholar]
- Fernández-Ontiveros, J. A., López-López, X., & Prieto, A. 2023, A&A, 670, A22 [NASA ADS] [CrossRef] [EDP Sciences] [Google Scholar]
- Fluetsch, A., Maiolino, R., Carniani, S., et al. 2021, MNRAS, 505, 5753 [NASA ADS] [CrossRef] [Google Scholar]
- Gallimore, J. F., Baum, S. A., & O’Dea, C. P. 2004, ApJ, 613, 794 [Google Scholar]
- Gallimore, J. F., Axon, D. J., O’Dea, C. P., Baum, S. A., & Pedlar, A. 2006, AJ, 132, 546 [NASA ADS] [CrossRef] [Google Scholar]
- García-Burillo, S., Combes, F., Usero, A., et al. 2014, A&A, 567, A125 [Google Scholar]
- González-Martín, O., Masegosa, J., Márquez, I., Guerrero, M. A., & Dultzin-Hacyan, D. 2006, A&A, 460, 45 [NASA ADS] [CrossRef] [EDP Sciences] [Google Scholar]
- González-Martín, O., Masegosa, J., Márquez, I., Guainazzi, M., & Jiménez-Bailón, E. 2009, A&A, 506, 1107 [NASA ADS] [CrossRef] [EDP Sciences] [Google Scholar]
- Heckman, T. M. 1980, A&A, 87, 152 [Google Scholar]
- Heckman, T. M., van Breugel, W., Miley, G. K., & Butcher, H. R. 1983, AJ, 88, 1077 [Google Scholar]
- Hermosa Muñoz, L., Márquez, I., Cazzoli, S., Masegosa, J., & Agís-González, B. 2022, A&A, 660, A133 [NASA ADS] [CrossRef] [EDP Sciences] [Google Scholar]
- Hermosa Muñoz, L., Cazzoli, S., Márquez, I., et al. 2024, A&A, 683, A43 [NASA ADS] [CrossRef] [EDP Sciences] [Google Scholar]
- Ho, L. C. 2008, ARA&A, 46, 475 [Google Scholar]
- Ho, L. C., Filippenko, A. V., & Sargent, W. L. W. 1997, ApJS, 112, 315 [NASA ADS] [CrossRef] [Google Scholar]
- Hota, A., & Saikia, D. J. 2006, MNRAS, 371, 945 [NASA ADS] [CrossRef] [Google Scholar]
- Hota, A., Saikia, D. J., & Irwin, J. A. 2007, MNRAS, 380, 1009 [NASA ADS] [CrossRef] [Google Scholar]
- Hummel, E., & Saikia, D. J. 1991, A&A, 249, 43 [NASA ADS] [Google Scholar]
- Hummel, E., van Gorkom, J. H., & Kotanyi, C. G. 1983, ApJ, 267, L5 [NASA ADS] [CrossRef] [Google Scholar]
- Irwin, J. A., English, J., & Sorathia, B. 1999, AJ, 117, 2102 [NASA ADS] [CrossRef] [Google Scholar]
- Keel, W. C. 1983, ApJ, 269, 466 [NASA ADS] [CrossRef] [Google Scholar]
- Kenney, J. D. P., & Yale, E. E. 2002, ApJ, 567, 865 [NASA ADS] [CrossRef] [Google Scholar]
- Kenney, J. D. P., Rubin, V. C., Planesas, P., & Young, J. S. 1995, ApJ, 438, 135 [Google Scholar]
- Kharb, P., Hota, A., Croston, J. H., et al. 2010, ApJ, 723, 580 [Google Scholar]
- Lee, S. W., Irwin, J. A., Dettmar, R. J., et al. 2001, A&A, 377, 759 [NASA ADS] [CrossRef] [EDP Sciences] [Google Scholar]
- Li, J.-T., Wang, Q. D., Wiegert, T., et al. 2022, MNRAS, 515, 2483 [Google Scholar]
- Lu, A., Haggard, D., Bureau, M., et al. 2025, MNRAS, 540, 71 [Google Scholar]
- Machacek, M. E., Jones, C., & Forman, W. R. 2004, ApJ, 610, 183 [Google Scholar]
- Mahajan, S., Ashby, M. L. N., Willner, S. P., et al. 2019, MNRAS, 482, 560 [NASA ADS] [CrossRef] [Google Scholar]
- Márquez, I., Masegosa, J., González-Martin, O., et al. 2017, Front. Astron. Space Sci., 4, 34 [CrossRef] [Google Scholar]
- Masegosa, J., Márquez, I., Ramirez, A., & González-Martín, O. 2011, A&A, 527, A23 [NASA ADS] [CrossRef] [EDP Sciences] [Google Scholar]
- Merloni, A., & Heinz, S. 2007, MNRAS, 381, 589 [Google Scholar]
- Mezcua, M., & Prieto, M. A. 2014, ApJ, 787, 62 [NASA ADS] [CrossRef] [Google Scholar]
- Moldon, J. 2021, Astrophysics Source Code Library [record ascl:2109.006] [Google Scholar]
- Morganti, R. 2017, Front. Astron. Space Sci., 4, 42 [CrossRef] [Google Scholar]
- Mukherjee, D. 2025, ArXiv e-prints [arXiv:2506.03888] [Google Scholar]
- Mukherjee, D., Bicknell, G. V., Wagner, A. Y., Sutherland, R. S., & Silk, J. 2018, MNRAS, 479, 5544 [NASA ADS] [CrossRef] [Google Scholar]
- Murthy, S., Morganti, R., Oosterloo, T., et al. 2025, A&A, 694, A110 [NASA ADS] [CrossRef] [EDP Sciences] [Google Scholar]
- Mutie, I. M., Williams-Baldwin, D., Beswick, R. J., et al. 2024, MNRAS, 527, 11756 [Google Scholar]
- Nagar, N. M., Falcke, H., Wilson, A. S., & Ulvestad, J. S. 2002, A&A, 392, 53 [NASA ADS] [CrossRef] [EDP Sciences] [Google Scholar]
- Narayan, R., Mahadevan, R., & Quataert, E. 1998, in Theory of Black Hole Accretion Disks, eds. M. A. Abramowicz, G. Björnsson, & J. E. Pringle, 148 [Google Scholar]
- Pacholczyk, A. G. 1970, Radio Astrophysics. Nonthermal Processes in Galactic and Extragalactic Sources (W.H. Freeman and Company) [Google Scholar]
- Panessa, F., Baldi, R. D., Laor, A., et al. 2019, Nat. Astron., 3, 387 [Google Scholar]
- Perucho, M. 2024, A&A, 684, A45 [NASA ADS] [CrossRef] [EDP Sciences] [Google Scholar]
- Schönell, A. J., Riffel, R. A., Riffel, R., & Storchi-Bergmann, T. 2025, MNRAS, 537, 3826 [Google Scholar]
- Smith, M. D., Smarr, L., Norman, M. L., & Wilson, J. R. 1983, ApJ, 264, 432 [Google Scholar]
- Stauffer, J. R. 1982, ApJ, 262, 66 [Google Scholar]
- Vollmer, B., Braine, J., Combes, F., & Sofue, Y. 2005, A&A, 441, 473 [NASA ADS] [CrossRef] [EDP Sciences] [Google Scholar]
- Vollmer, B., Wong, O. I., Braine, J., Chung, A., & Kenney, J. D. P. 2012, A&A, 543, A33 [NASA ADS] [CrossRef] [EDP Sciences] [Google Scholar]
- Wiita, P. J. 1978, ApJ, 221, 41 [Google Scholar]
- Williams, D. R. A., McHardy, I. M., Baldi, R. D., et al. 2019, MNRAS, 486, 4962 [Google Scholar]
MEGARA: Multi-Espectrógrafo en GTC de Alta Resolución para Astronomía/GTC: Gran Telescopio de Canarias.
e-MERLIN: https://www.e-merlin.ac.uk
VLA configuration and resolutions: https://science.nrao.edu/facilities/vla/docs/manuals/oss/performance
See other examples of e-MERLIN and VLA combination for NGC 6217 (Williams et al. 2019) and NGC 1068 (Mutie et al. 2024).
Reduction tutorial: https://casaguides.nrao.edu/index.php?title=VLA_Continuum_Tutorial_3C391-CASA6.4.1
National Radio Astronomy Observatory. “VLA CASA Pipeline”. Available on https://science.nrao.edu/facilities/vla/data-processing/pipeline
The flux density is converted from Jy beam−1 to Jy/pixel for this analysis.
l is the line-of-sight distance through the galaxy at that pixel (Irwin et al. 1999). Following Hota et al. (2007), we use a geometry in which the line-of-sight depth is taken to be the measured average width of the mini double-lobed source, that is, 4.21 arcsec = 344 pc.
The dependence between Bmin and k is weak (Bmin ∝ k2/7) and well behaved in this range. Common values of k are discussed on https://www.cv.nrao.edu/~sransom/web/Ch5.html
We note that neither MEKAL nor PL gave satisfactory fits for the nucleus.
Appendix A: Acknowledgements
Authors acknowledge the anonymous referee for their constructive comments to improve the paper.
We acknowledge the VLA operations and support team for their assistance in the preparation and execution of the X-band 24B-323 project observations. The VLA is operated by the National Radio Astronomy Observatory (NRAO). The NRAO is a facility of the National Science Foundation operated under a cooperative agreement by Associated Universities, Inc. We thank the e-MERLIN Observation Support Scientists for the successful acquisition of the data and for their accuracy and dedication in ensuring proper calibration of L-band CY16021 data. e-MERLIN is a National Facility operated by the University of Manchester at Jodrell Bank Observatory on behalf of Science and Technologies Facilities Council (STFC).
We thank the attention and feedback from Professor Judith Irwin and Dr. Ananda Hota, regarding their model application.
We thank Dr. Lucatelli for the interesting discussions about the methodology presented.
This publication is part of the I+D+i project PID2022-140871NB-C21, financed by MCIN/AEI/10.13039/501100011033/ and FEDER,UE. MPS, IM, JMasegosa, SC acknowledge the grant PID2022-23 140871NB-C21 funded by MCIN/AEI/10.13039/501100011033 and FEDER,UE. MPS acknowledges financial support from MCIN/AEI/1013039/50110001103 and FSE+ under the grant PRE2021-100265, which is part of the SEV-2017-0709.
JMoldón acknowledges financial support from the National grant PID2023-147883NB-C21, funded by MICIU/AEI/ 10.13039/501100011033.
MPS and JMoldón acknowledge the Spanish Prototype of an SRC (SPSRC) service and support funded by the MICIU, by the Junta de Andalucía, by the European Regional Development Funds (ERDF) and by the European Union NextGenerationEU/PRTR. The SPSRC and MPS, JMoldón, IM, JMasegosa, SC and OGM acknowledge financial support from the Agencia Estatal de Investigación (AEI) through the ‘Center of Excellence Severo Ochoa to the Instituto de Astrofísica de Andalucía (IAA-CSIC) (SEV-2017-0709) and CEX2021-001131-S funded by MICIU/AEI/10.13039/501100011033.
OGM acknowledges the financial support from the Ciencia de Fontera project CF-2023-6100 (SECIHTI) and PAPIIT project IN109123 (UNAM).
LHM acknowledges financial support by the grant PID2021-124665NB-I00 funded by the Spanish Ministry of Science and Innovation and the State Agency of Research MCIN/AEI/10.13039/501100011033 PID2021-124665NB-I00 and ERDF A way of making Europe.
MPS has received funding from the European Union’s Horizon 2020 research and innovation programme under grant agreement No 101004719 (Opticon Radionet Pilot, ORP), employed in a e-MERLIN data training.
All Tables
All Figures
|
Fig. 1. NGC 4438 radio structures. Top: C-band image from VLA data. Centre: L-band image from blending e-MERLIN and VLA data. Bottom: X-band image with VLA data. Contours: We represent the −3σ regions in green, the two black contours represent 3σ and 0.05 mJy, and the three white ones 0.075 mJy, 0.15 mJy, and 0.35 mJy. The ellipse in the bottom left indicates the restoring beam. Despite the similar resolution in the C- and X-band images, the diffuse emission captured in the C band makes the image appear smoother. This is an intrinsic effect limited by wavelength. |
| In the text | |
|
Fig. 2. Scheme presenting the substructures of NGC 4438. It is based on the C-band image (see Fig. 1 and Sect. 5.1). The contours are at 3σ, 0.03 mJy, 0.08 mJy, 0.2 mJy, and 0.35 mJy. The orange line shows the hourglass-like structure mentioned in the Sect. 5.1. The NW side of the orange figure encloses the region referred to as the ‘base of the cone’. We name the circular cavity in the main bubble (blue circle) the ‘hole’. |
| In the text | |
|
Fig. 3. Top: C-band spectral index map created pixel by pixel with a S/N threshold of 5. Bottom: Error in the spectral index value for each pixel. |
| In the text | |
|
Fig. 4. Maps of the minimum energy parameters assuming k = 40. (a) Magnetic field strength (Bmin). (b) Cosmic-ray energy density, |
| In the text | |
|
Fig. 5. X-ray Chandra images with radio C-band contours. Top: Soft X-rays (0.5−2 keV). Bottom: Hard X-rays (2−10 keV; see Sects. 3.3 and 5.6 for details). Contours: 3σ (black), 0.05 mJy (white), 0.075 mJy (black), 0.15 mJy (white), and 0.35 mJy (black). The 0.35 mJy contour locates the nucleus. In the bottom panel, we indicate the five regions in which we have fitted spectra: (1) Nuclear, (2) North, (3) South, (4) West, and (5) External. |
| In the text | |
|
Fig. 6. Composite RGB image of NGC 4438 using Hα emission (green), C-band radio emission (red), and X-rays in the 0.5−10 keV energy band (blue). The optical data were taken from the HST archive. The C-band image is the one presented in this paper. The X-ray image is the sum of the two components (hard and soft) shown in Fig. 5. |
| In the text | |
|
Fig. 7. Flux maps of ionised gas (Hα) kinematical components of NGC 4438 with C-band radio contours (0.08 mJy, 0.2 mJy, and 0.35 mJy). The maps show the integrated Hα flux per spaxel of MEGARA, and were provided by Hermosa Muñoz et al. (2024). Both components are related to non-rotational motions (i.e. outflow). Details are given in Hermosa Muñoz et al. (2024). |
| In the text | |
Current usage metrics show cumulative count of Article Views (full-text article views including HTML views, PDF and ePub downloads, according to the available data) and Abstracts Views on Vision4Press platform.
Data correspond to usage on the plateform after 2015. The current usage metrics is available 48-96 hours after online publication and is updated daily on week days.
Initial download of the metrics may take a while.