Open Access
Fig. 6.
Download original image
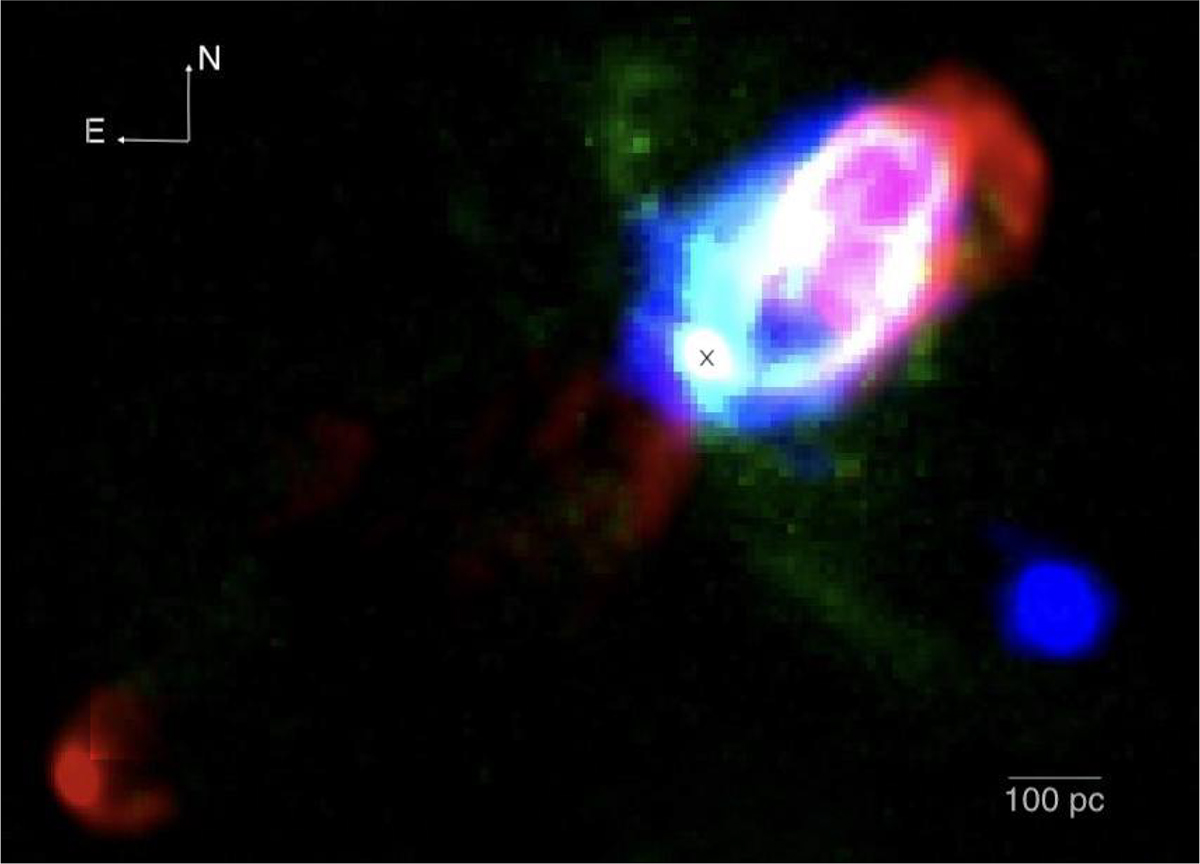
Composite RGB image of NGC 4438 using Hα emission (green), C-band radio emission (red), and X-rays in the 0.5−10 keV energy band (blue). The optical data were taken from the HST archive. The C-band image is the one presented in this paper. The X-ray image is the sum of the two components (hard and soft) shown in Fig. 5.
Current usage metrics show cumulative count of Article Views (full-text article views including HTML views, PDF and ePub downloads, according to the available data) and Abstracts Views on Vision4Press platform.
Data correspond to usage on the plateform after 2015. The current usage metrics is available 48-96 hours after online publication and is updated daily on week days.
Initial download of the metrics may take a while.