Fig. 3.
Download original image
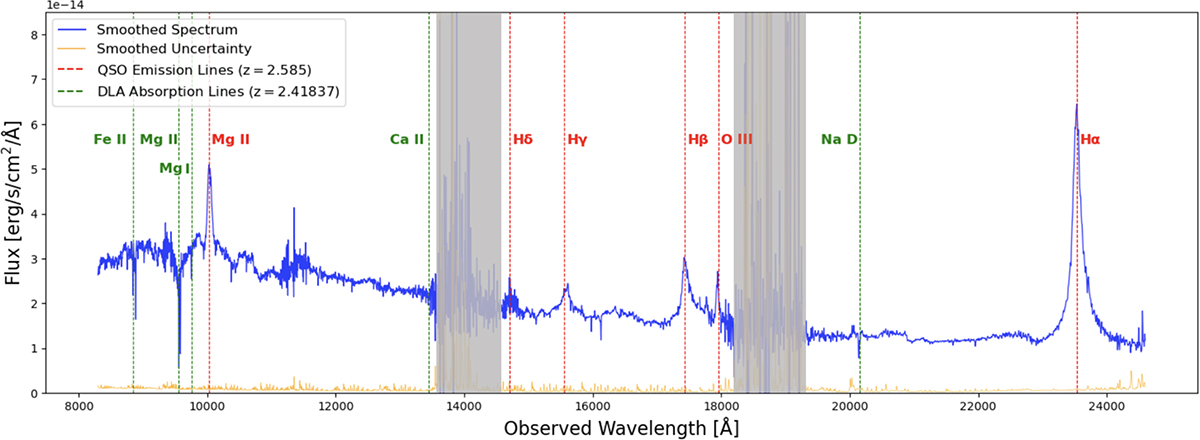
Magellan/FIRE spectrum of QSO J1439+1117 (blue; smoothed with a 4-pixel Gaussian kernel) and spectral uncertainty (orange). Dashed red lines mark the main QSO emission lines at z = 2.585, while dashed green lines mark sub-DLA absorption lines at z = 2.41837. Spectral windows with poor atmospheric transmission are marked in gray.
Current usage metrics show cumulative count of Article Views (full-text article views including HTML views, PDF and ePub downloads, according to the available data) and Abstracts Views on Vision4Press platform.
Data correspond to usage on the plateform after 2015. The current usage metrics is available 48-96 hours after online publication and is updated daily on week days.
Initial download of the metrics may take a while.