| Issue |
A&A
Volume 707, March 2026
|
|
|---|---|---|
| Article Number | A146 | |
| Number of page(s) | 9 | |
| Section | Extragalactic astronomy | |
| DOI | https://doi.org/10.1051/0004-6361/202556336 | |
| Published online | 03 March 2026 | |
Empirical calibration of Na I D and other absorption lines as tracers of high-redshift neutral outflows
1
Dipartimento di Fisica e Astronomia, Università di Bologna Bologna, Italy
2
The Observatories of the Carnegie Institution for Science Pasadena CA, USA
3
Center for Astrophysics | Harvard & Smithsonian Cambridge MA, USA
4
INAF, Astrophysics and Space Science Observatory Bologna, Italy
5
Caltech/IPAC Pasadena CA, USA
6
National Centre for Nuclear Research Warsaw, Poland
7
SISSA Trieste, Italy
★ Corresponding author: This email address is being protected from spambots. You need JavaScript enabled to view it.
Received:
9
July
2025
Accepted:
23
December
2025
Abstract
Recent JWST observations of massive galaxies at z > 2 detect blueshifted absorption in Na I D and other resonant absorption lines, indicative of strong gas outflows in the neutral phase. However, the measured mass outflow rates are highly uncertain because JWST observations can only probe the column density of trace elements such as sodium, while most of the gas is in the form of hydrogen. The conversion between the column density of sodium and that of hydrogen is based on observations of gas clouds within the Milky Way, and has not been directly tested for massive galaxies at high redshift. To test this conversion, we studied a unique system consisting of a massive quiescent galaxy (J1439B) at z = 2.4189, located at a projected distance of 38 physical kiloparsecs from the bright background quasar QSO J1439+1117. The neutral outflow from the galaxy is observed as a sub-damped Lyman-α absorber (sub-DLA) in the spectrum of the background quasar, which enables a direct measurement of the hydrogen column density from Lyman transitions. We obtained new near-infrared spectroscopy with Magellan/FIRE and detect Na I D and other resonant absorption lines from Mg II, Mg I, and Fe II. This dataset allows us to derive new empirical calibrations between the column densities of trace elements and hydrogen, which can be used to estimate the mass and the rate of neutral gas outflows in other massive quiescent galaxies at high redshift. The calibration we derive for Na I is only 30% lower than the local relation that is typically assumed at high redshift, confirming that the neutral outflows observed with JWST at z > 2 can remove a large amount of gas and likely play a key role in galaxy quenching. However, using the local calibration for Mg II yields an order-of-magnitude discrepancy compared to the empirical calibration, possibly due to variations in dust depletion.
Key words: galaxies: evolution / galaxies: high-redshift / intergalactic medium / galaxies: jets / quasars: absorption lines
© The Authors 2026
 Open Access article, published by EDP Sciences, under the terms of the Creative Commons Attribution License (https://creativecommons.org/licenses/by/4.0), which permits unrestricted use, distribution, and reproduction in any medium, provided the original work is properly cited.
This article is published in open access under the Subscribe to Open model. This email address is being protected from spambots. You need JavaScript enabled to view it. to support open access publication.
1. Introduction
Gas outflows play a crucial role in galaxy formation and evolution and may be responsible for shutting down star formation in massive systems. However, direct observational evidence for a major impact of outflows on the star formation history of massive galaxies has been difficult to obtain, in part because the multiphase nature of galaxy outflows complicates measurements of the total mass ejected (Förster Schreiber & Wuyts 2020; Veilleux et al. 2020). This observational challenge is one of the main obstacles in the search for a direct link between galaxy quenching and outflows driven by active galactic nuclei (AGN) (e.g., Harrison 2017; Cicone et al. 2018).
At z ∼ 2, when massive galaxies begin entering the quenching phase in large numbers, observational studies have identified widespread ionized outflows, which can be detected via strong emission lines (e.g., Förster Schreiber et al. 2014); however, the corresponding mass outflow rates are low, meaning that ionized outflows are unlikely to shut off star formation and drive galaxy quenching (e.g., Lamperti et al. 2021; Concas et al. 2022). Most of the outflow mass is expected to be in the cold phase (Veilleux et al. 2020), which is particularly difficult to detect at high redshift. Submillimeter observations probe cold molecular gas, but detecting outflows in normal galaxies (as opposed to quasars) with this method is challenging (e.g., Herrera-Camus et al. 2019; Spilker et al. 2020; Barfety et al. 2025). Alternatively, metal absorption lines in the rest-frame optical or UV can be used to trace the neutral atomic phase. This approach has been successful in the local and low-redshift Universe (e.g., Rupke et al. 2005; Tremonti et al. 2007), but requires a high signal-to-noise ratio on the galaxy continuum emission, which until recently was out of reach for galaxies at z > 1 without resorting to stacking (Steidel et al. 2010; Maltby et al. 2019; Taylor et al. 2024) or strong gravitational lensing (Pettini et al. 2002; Jafariyazani et al. 2020; Man et al. 2021).
The advent of JWST has enabled a major step forward in the field, making it possible to detect metal absorption lines resulting from a neutral atomic gas in high-redshift galaxies. Neutral gas measurements are typically obtained from the Na I D doublet (Davies et al. 2024; Belli et al. 2024; D’Eugenio et al. 2024; Sun et al. 2026), but Ca, Mg, and Fe absorption lines have also been used (Liboni et al. 2026; Wu 2025; Valentino et al. 2025). By measuring the mass and kinematics of the dense, neutral gas phase, these studies conclude that outflows observed in massive galaxies can remove the majority of the gas reservoir, thus leading to galaxy quenching. However, these early results are affected by strong systematics, resulting in an order-of-magnitude uncertainty in the measured mass outflow rate (Belli et al. 2024). The major source of uncertainty arises because observations can only probe a trace element such as sodium, while most of the mass is hydrogen. Therefore, a conversion of the observed column density NX, i (i.e., element X in the i-th ionization stage) to the column density of neutral hydrogen NH I is required. The conversion can be expressed as (e.g., Rupke et al. 2005)
![Mathematical equation: $$ \begin{aligned} N_{\rm H\ I} = \frac{N_{\rm X,i}}{(n_{\rm X,i}/n_{\rm X}) \cdot 10^{[\mathrm{X/H}]} \, (n_{\rm X}/n_{\rm H})_\odot \, 10^{\delta _{\rm X}}}\cdot \end{aligned} $$](/articles/aa/full_html/2026/03/aa56336-25/aa56336-25-eq1.gif) (1)
(1)
This calibration requires knowledge of three physical quantities: the ionization fraction (nX, i/nX), the depletion onto dust δX, and the elemental abundance in the gas, which is expressed as the product of the abundance relative to solar, 10[X/H], and the abundance in the Sun (nX/nH)⊙. These properties can be accurately measured in Milky Way regions, and the local values are adopted when studying extragalactic systems. For example, common assumptions for Na I are (nNa I/nNa) = 0.1 (indicating that only 10% of the sodium is in the neutral phase) and δNa = −0.95, together with log(nNa/nH)⊙ = −5.69 (Savage & Sembach 1996; Rupke et al. 2005). The sodium abundance in the outflow is rarely measured, and for massive galaxies it is often assumed that [Na/H] = 0, meaning the gas has solar abundance. With these assumptions, Eq. (1) gives the Na-to-H conversion as
 (2)
(2)
The calibration discussed above has several limitations. First, variations in dust depletion, ionization correction, and metal abundances along different lines of sight in the Milky Way can lead to differences in calibration of up to an order of magnitude (Rupke et al. 2002). Second, the physical conditions in large-scale outflows at high redshift are expected to substantially differ from those in the Milky Way due to factors such as shocks, AGN-driven photoionization, and potentially different dust compositions.
In this study, we address these limitations by directly measuring the column densities of both sodium and hydrogen in the large-scale outflow near J1439B, a massive quiescent galaxy at z = 2.4189 (Rudie et al. 2017). This measurement is possible because of the chance alignment between the galaxy outflow and a background quasar, which emits a strong, continuous spectrum extending into the rest-frame UV. Background quasars have been successfully used to probe outflows in star-forming galaxies at z < 1 (e.g., Bouché et al. 2012; Schroetter et al. 2019; Martin et al. 2019). However, J1439B represents the only case in which the background quasar probes the outflow for a high-redshift quiescent galaxy, making it particularly well-suited for the study of galaxy quenching at z ≳ 2.
This work combines literature measurements of the H I column density in the outflow, derived from high-resolution optical spectroscopy (Srianand et al. 2008; Noterdaeme et al. 2008), with new measurements of Na I D and other resonant absorption lines obtained from Magellan/FIRE near-infrared spectroscopy. Therefore, we provide an empirical direct calibration of Na I, Mg I, Mg II and Fe II as tracers of hydrogen in neutral outflows, independent of the assumptions required by previous methods. In Section 2 we review the system’s physical properties reported in previous studies and perform a fit to the galaxy’s broadband photometry to estimate its properties. In Section 3, we introduce new near-infrared spectroscopic data and describe the equivalent width measurements. In Section 4, we provide empirical calibrations for Na I, Mg II, Mg I, and Fe II. Finally, we summarize and discuss our results in Section 5.
2. The system
The system studied in this work consists of J1439B, a massive galaxy at z = 2.4189, and a sub-damped Lyman-α absorber (sub-DLA) at roughly the same redshift, observed in the spectrum of the background quasar QSO J1439+1117. The separation between the galaxy and the QSO line of sight is  , corresponding to 38 physical kiloparsecs at the galaxy redshift.
We interpret the sub-DLA as part of a large-scale outflow ejected by J1439B, as illustrated in Figure 1. This interpretation is motivated by the unusually high metallicity and molecular gas fraction measured in the sub-DLA, which indicate that the gas must have been ejected by a massive galaxy. Moreover, the velocities of the sub-DLA components span a range of approximately 1000 km/s, indicating an energetic process and ruling out an inflow origin for the observed gas, as inflow velocities are typically much smaller (e.g., Goerdt & Ceverino 2015; Nelson et al. 2016). In this section, we summarize the properties of both the galaxy and the outflow (see Rudie et al. 2017 for a more thorough analysis of the system).
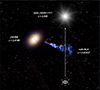 |
Fig. 1. Artistic illustration of galaxy J1439B and its outflow. The outflow appears as a sub-DLA in the spectrum of the background quasar J1439+1117. |
2.1. The outflow
The outflow of J1439B was first identified as a z = 2.41837 absorber in the spectrum of QSO J1439+1117 by Srianand et al. (2008) and Noterdaeme et al. (2008), who characterized its physical properties using a high-resolution VLT/UVES spectrum. Analysis of the Ly-α damping wings and the Ly-β and Ly-γ absorption lines yields a neutral hydrogen column density of log NH I = 20.1 ± 0.1, which is just below the classical DLA threshold (log NHI > 20.3). The authors also detected four additional components with velocities spanning 0 to −1000 km/s and column densities of at least a factor of five lower than that of the main absorber.
This sub-DLA is particularly notable for its high chemical enrichment, with approximately solar metallicity, and for the detection of molecular gas through CO absorption lines, corresponding to a molecular fraction f = 2NH2/(NH I + 2NH2) = 0.27 ± 0.10 (Srianand et al. 2008). These properties are highly unusual for a DLA or sub-DLA system but align with expectations for gas outflowing from a massive, evolved galaxy.
2.2. The galaxy
Rudie et al. (2017) discovered and analyzed the galaxy J1439B in a search for possible counterparts to the sub-DLA at z = 2.41837. A near-infrared spectrum of the galaxy obtained with Magellan/FIRE reveals Hα, Hβ, [N II], and [O III] emission lines at a redshift z = 2.4189, corresponding to a separation from the main sub-DLA component of 47 km/s along the line-of-sight. The line ratios are inconsistent with ionization by young stars and lie in the AGN region of the BPT diagram (Baldwin et al. 1981). Moreover, the relatively large velocity dispersion of the forbidden line [O III] suggests the presence of an ionized outflow, likely driven by AGN activity.
Rudie et al. (2017) also obtained broad-band photometry of J1439B in seven optical and near-infrared bands using the Magellan telescopes. Fitting the spectral energy distribution (SED) with FAST (Kriek et al. 2009), assuming an exponentially declining star formation history, yields a young, massive galaxy (log M*/M⊙ = 10.7) with a relatively low star formation rate (SFR =  yr−1), which places J1439B about 0.7 dex below the main sequence of star formation (e.g., Shivaei et al. 2015; Leja et al. 2022).
2.3. Prospector fit to the broadband photometry
To further constrain the physical properties of galaxy J1439B, we performed a new SED fit to the photometric measurements provided by Rudie et al. (2017). We used the Prospector code (Johnson et al. 2021), which employs a substantially more flexible model than FAST, yielding more accurate results and realistic uncertainties.
We modeled the galaxy emission using a non-parametric star formation history in 14 time bins, adopting a continuity prior to ensure smooth transitions between adjacent time bins (Leja et al. 2019). The stellar templates were taken from the flexible stellar population synthesis (FSPS) library (Conroy et al. 2009; Conroy & Gunn 2010), assuming a Chabrier (2003) initial mass function (IMF), with the redshift fixed to the spectroscopic value. The model also includes parameters for metallicity and dust attenuation, treated using the parametrization of Kriek & Conroy (2013). The attenuation AV and the ratio of diffuse-to-birth-cloud dust were left free, while the dust extinction index, which quantifies deviations from the canonical Calzetti et al. (2000) extinction law, was fixed to zero. This choice is supported by a recent study of massive quiescent galaxies with deep JWST spectroscopy (Park et al. 2024). The model does not include contributions from dust and nebular emission.
To account for potential systematics, we added a 5% uncertainty in quadrature to the photometric errors and included the fraction of possible photometric outliers as a free parameter in Prospector. We performed SED fitting using the nested sampling method implemented in the dynesty package (Speagle 2020). The best-fit SED model, evaluated at the maximum a posteriori (MAP) point in parameter space provides a good fit to the observed broadband photometry (Figure 2).
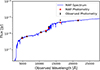 |
Fig. 2. Spectral energy distribution (SED) fit to the broadband photometry of galaxy J1439B. The blue line represents the model spectrum, red squares represent the best-fit model photometry, and black circles with error bars indicate the observed photometry. |
The Prospector fit yields log M*/M⊙ = 10.9 ± 0.2, log SFR/(M⊙ yr−1) = 1.2 ± 0.8, and AV = 0.6 ± 0.4. These results agree broadly with those obtained by Rudie et al. (2017) using FAST, but show a much larger uncertainty in the measured parameters. The best-fit star formation history shows a decline over the past gigayear, suggesting a recent quenching phase, although the posterior distribution spans a wide range of shapes and normalizations. We conclude that the available photometry for J1439B is insufficient to robustly determine the star formation history. However, the quiescent nature of the galaxy is independently confirmed by the FIRE spectrum obtained by Rudie et al. (2017): the observed Hα luminosity, which is likely contaminated by AGN emission, provides an upper limit of SFR < 13 M⊙/yr using the Kennicutt (1998) calibration converted to a Chabrier IMF. The SFR estimate accounts for the dust attenuation derived from the observed Balmer decrement, which is consistent with the best-fit value of AV obtained with Prospector.
As discussed in Section 2.2, J1439B likely hosts an AGN, which could, in principle, affect the SED fitting results. Prospector includes a model for the emission by hot dust in the AGN torus; however, this is only relevant in the mid-infrared (Leja et al. 2018). Since we lack observations of J1439B beyond the near-infrared, we did not include the AGN model in the Prospector fit. Strong AGN emission in the rest-frame UV and optical range is unlikely, as a fit based only on stellar and dust components reproduces the observed photometry reasonably well. Furthermore, the stellar Balmer break is clearly detected in the observed photometry (Figure 2), confirming that the AGN continuum emission at these wavelengths is negligible relative to the stellar component.
3. Absorption line measurements
3.1. Spectroscopic data
We observed QSO J1439+1117 using the Folded-port InfraRed Echellette (FIRE) spectrograph on the Baade Magellan telescope in Chile. The FIRE spectrograph is a near-infrared, cross-dispersed echelle spectrograph that provides medium-resolution spectroscopy over the full near-infrared range (0.8−2.5 μm). Observations were conducted on 9−10 March 2024, using a 6″ × 0.6″ slit, yielding a spectral resolution R ∼ 6000. We adopted an AB dithering pattern with 20-minute exposures offset by 3″. The total exposure time was 160 minutes under good weather conditions, with 0.6″ seeing in the near-infrared. The observations were reduced using the FIREHOSE pipeline (Gagné et al. 2015) that includes flat-fielding, wavelength calibration, illumination correction, and slit tilt correction. We also observed an A0V star close to the target and used its spectrum to perform the telluric correction with the xtellcorr package (Vacca et al. 2003). After extracting the 1D spectrum for each of the A and B nod positions, we detected a spurious absorption feature in the source spectrum at 20148.7 Å, close to the Na D doublet. This feature is caused by a detector defect that lies near the source spectrum only in the A position. When combining the A-B and B-A spectra, we therefore excluded the A-B spectrum in the region around Na D, yielding a combined spectrum with half the exposure time, but which is free of artifacts. Figure 3 shows the final 1D spectrum, which is publicly available1. Both emission lines from the QSO at z = 2.585 and absorption lines from the sub-DLA at z = 2.41837 are present in the spectrum.
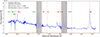 |
Fig. 3. Magellan/FIRE spectrum of QSO J1439+1117 (blue; smoothed with a 4-pixel Gaussian kernel) and spectral uncertainty (orange). Dashed red lines mark the main QSO emission lines at z = 2.585, while dashed green lines mark sub-DLA absorption lines at z = 2.41837. Spectral windows with poor atmospheric transmission are marked in gray. |
This system was also previously observed in the optical by Srianand et al. (2008) and Noterdaeme et al. (2008) using the Ultraviolet and Visual Echelle Spectrograph (UVES) on the Very Large Telescope (VLT), under ESO program 278.A-5062(A). The UVES spectrum covers the 3300−7100 Å range with a resolving power of R = 50 000. We used this high-resolution spectrum solely for visualization purposes. For each velocity component, we adopted the hydrogen column densities measured from the UVES data by Srianand et al. (2008).
3.2. Equivalent width measurements
The FIRE spectrum shows several resonant absorption lines due to cold gas: Fe II 2586, 2600, Mg II 2796, 2803, Mg I 2853, and Na I 5891, 5897 (the Na I D doublet). These are shown in Figure 4, plotted relative to the systemic redshift of the J1439B galaxy, with the spectral continuum normalized to a value of one in each region. We also searched for the Ca II 3934, 3969 doublet (Ca II H and K lines), but at the sub-DLA redshift these wavelengths lie in a region of very low atmospheric transmission, preventing detection of absorption. The bottom panels of Figure 4 show selected rest-frame UV transitions from the UVES spectrum: O I 1302, Fe II 1608, and Al II 1670. Vertical dashed lines mark four velocity components for which Srianand et al. (2008) and Noterdaeme et al. (2008) measured H I column densities from Voigt fits to the Lyman absorption lines. These components are located at −47, −164, −428, and −640 km/s relative to the galaxy systemic redshift, with column densities of log NH I = 20.1, 19.4, 19.2, and 19.2, respectively. A fifth component at −938 km/s is much weaker (log NH I = 17.8) and lies outside the velocity range shown in the figure.
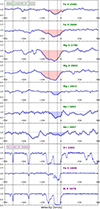 |
Fig. 4. Absorption features in the QSO J1439+1117 spectrum in velocity space, with zero corresponding to the systemic velocity of galaxy J1439B. Normalized flux is shown on the y axis of each panel. Top panels: Fe II, Mg II, Mg I, and Na I transitions in the FIRE spectrum. The shaded areas represent the spectral regions used for EW calculations of the component at −47 km/s (shaded blue areas), or for the sum of the components at −47 and −164 km/s, when blended (shaded red areas). Bottom panels: O I, Fe II, and Al II in the higher-resolution UVES data. Vertical dashed lines mark the absorbers used to fit the H I distribution in Srianand et al. (2008) and Noterdaeme et al. (2008). |
The kinematic structure of the sub-DLA in the high-resolution UVES spectrum appears complex, with the outflow consisting of multiple cloudlets, each at different velocities, as indicated by distinct absorption profiles of the same element at varying velocities. All absorption lines are blueshifted by several tens to hundreds of kilometers per second, providing clear evidence of a neutral outflow toward the observer. The absorption lines in the FIRE spectrum align with the strongest velocity components but appear broader because of the lower spectral resolution. Moreover, for the Mg II and Fe II lines, saturated absorption causes blending between the main sub-DLA component at −47 km/s and the adjacent component at −164 km/s, similar to O I in the UVES spectrum.
We measured the equivalent width (EW) of each transition in the FIRE spectrum to quantify the absorption strength. For Mg I and Na I, we integrated the spectrum only in the wavelength region corresponding to the strongest velocity component at −47 km/s (Figure 4, shaded blue areas), whereas for Mg II and Fe II we measured the combined EW of the −47 km/s and −164 km/s components, which are blended (Figure 4, shaded red areas). All EW measurements are reported in Appendix A.
4. Empirical calibrations of the column densities
This section compares the hydrogen column density with the column densities of sodium, magnesium, and iron measured in the sub-DLA. Our goal was to obtain an empirical calibration that can be used in future studies to estimate a system’s hydrogen column density from the measured column density for one of the metals.
The hydrogen column density of the sub-DLA derives from rest-UV spectroscopy (Srianand et al. 2008). For the metal lines, we derived the column density from the EWs measured in Section 3, using the relation valid in the optically thin regime (e.g., Draine 2011):
 (3)
(3)
where λ0 is the rest-frame wavelength of the transition and f is its oscillator strength. In the optically thick regime, the same observed EW corresponds to a higher number of atoms, and this relation provides only a lower limit on the column density. The doublet ratio can be used to discriminate between the two regimes: in the optically thin case, it is roughly equal to the ratio of the oscillator strengths, while in the optically thick case, absorption lines saturate and the ratio approaches one. Measurements of doublet ratios and column densities are reported in Appendix A.
4.1. Sodium
The Na I doublet ratio for the −47 km/s velocity component is consistent with the theoretical value of ∼2, indicating that the absorption is optically thin. We thus derive a robust measurement of the Na I column density (Table A.1). Comparing this to the H I column density for the same velocity component, we obtain a column density ratio log(NH I/NNa I) = 7.5 ± 0.1. We now assume that the relation between NH I and NNa I is linear, analogous to Equation (1) for the local calibration. With this assumption, we derive an empirical calibration that can be used to infer the hydrogen mass from the observed Na I absorption in other outflows:
 (4)
(4)
This calibration does not depend on the assumed values for dust depletion, ionization correction, and abundance, as it is based entirely on the observed number of Na I and H I atoms in the sub-DLA. Our empirical calibration yields a hydrogen column density of 0.14 dex, or approximately 30%, smaller than the local calibration of Rupke et al. (2005) given in Eq. (2). The discrepancy is modest, considering that the local calibration depends on depletion, ionization correction, and abundance assumptions which have high levels of uncertainty.
4.2. Magnesium
The Mg II doublet ratio, measured for the sum of the velocity components at −47 km/s and −164 km/s, is consistent with unity, indicating strong line saturation since the optically thin value is ∼2. We therefore used the observed EW to derive a lower limit on the Mg II column density, which we compared to the H I column density for the two velocity components (Table A.2). This results in an upper limit on the Mg II-to-H I calibration. To further constrain the calibration, we also considered the shallower – and thus unsaturated – Mg II absorption features at v = −428 km/s and v = −640 km/s. In these cases, the absorption lines are undetected, yielding an upper limit on the column density and a lower limit on the calibration. We discarded the v = −428 km/s component because the spectrum is affected by strong residuals of unknown origin. For the component at v = −640 km/s, we measured an upper limit on the EW as follows. We assumed that the Mg II absorption is spectrally unresolved in the FIRE data, as confirmed by the line widths of UV transitions in the UVES spectra (Figure 4). Given the FIRE spectral resolution R ∼ 6000, we calculated a line width of 85 km/s, corresponding to 2σ on either side. We then measured the largest fluctuation of the normalized spectrum within the expected line width and multiplied this number by the expected line width (in angstrom) to obtain the upper limit on the EW. This conservative measurement accounts for systematic uncertainties and imperfect normalization of the spectrum; if some of the observed features arise from genuine absorption of Mg II, the true EW will remain below our estimated upper limit. We then converted this EW limit to an upper limit on the column density of Mg II and compared it to the column density of H I of the velocity component at −640 km/s (Table A.2).
Analysis of different velocity components yielded an upper and a lower limit for the Mg II-to-H I column density ratio. Each velocity component corresponds to a different gas clump, and we assume that these clumps share similar physical conditions, because their column densities differ by at most an order of magnitude (19.2 < log NH I < 20.1). We combined the upper and lower limits, obtaining a relatively narrow range of values: 6.2 < log(NH I/NMg II) < 6.4. From this we derive the approximate empirical calibration:
 (5)
(5)
This empirical calibration yields an H I column density about an order of magnitude larger than the local calibration (Eq. 1) under standard assumptions, i.e., most of the Mg atoms are singly ionized, the Mg abundance equals the solar value log(nMg/nH)⊙ = −4.4, and the dust depletion is δMg = −0.8 (Savage & Sembach 1996; Jenkins 2009; Wu 2025). Some of these standard local assumptions must therefore be substantially incorrect.
We directly tested the degree of ionization of Mg atoms in the absorbing gas using the Mg I transition detected in the FIRE spectrum. We derive a column density for the v = −47 km/s component of log NMg I = 12.3 (Table A.3), which is at least 30 times smaller than the column density of Mg II, since log NMg II > 13.8. One caveat is that the column density of Mg II is measured for the mixture of the components v = −47 km/s and v = −164 km/s. However, we can assume that the v = −47 km/s component is the dominant one, since it includes nearly 90% of the total amount of neutral hydrogen (Srianand et al. 2008). We conclude that most Mg atoms are ionized, consistent with local measurements, and ionization corrections do not explain the discrepancy between the high-redshift empirical calibration and the local calibration.
Finally, we provide the Mg I calibration derived empirically from our column density measurements:
 (6)
(6)
4.3. Iron
The Fe II 2586, 2600 doublet ratio is 2.0 ± 0.1, which is substantially lower than the optically thin value of ∼4 and indicates saturation. We thus derive a lower limit on the column density of NFe II, which corresponds to an upper limit on the NH I/NFe II calibration (Table A.4). The UVES spectrum also contains an optically thin Fe II transition (Fe II 1608, Figure 4), which Noterdaeme et al. (2008) used to derive a column density of log NFe II = 14.28 ± 0.05 for the main velocity component. We used this value to derive a calibration for Fe II, given by
 (7)
(7)
This calibration yields a neutral hydrogen column density that is 0.4 dex lower than the local calibration with the default assumptions for Fe II, i.e., all atoms are singly ionized, with log(nFe/nH)⊙ = −4.5, and δFe = −1.7 (Savage & Sembach 1996; Jenkins 2009; Wu 2025).
5. Summary and discussion
We have carried out a detailed analysis of a unique system consisting of J1439B, a massive quiescent galaxy at z = 2.4189, and a sub-DLA at z = 2.41837 ejected by the galaxy, located ∼38 physical kiloparsecs away in projection. The coincidental alignment of this outflow region with a bright background quasar enabled a detailed study of the relative abundance of metals and hydrogen in the neutral phase of the outflowing gas.
Our main result is the derivation of empirical relations, presented in Eqs. (4), (5), (6), and (7), between the metal column densities derived from resonant Na I, Mg II, Mg I, and Fe II absorption lines and the hydrogen column density directly measured from Lyman absorption. This work provides an empirical basis for characterizing galactic outflows in the early Universe, offering a crucial step toward quantifying the role of feedback in shaping galaxy evolution.
We compared our high-redshift empirical calibrations with those derived from local measurements using Eq. (1). Figure 5 and Table 1 present the comparison and list the commonly adopted values of ionization correction, elemental abundance, and dust depletion. The calibrations based on local measurements yield hydrogen column densities that are 0.14 dex and 0.4 dex higher than our empirical calibrations for Na I and Fe II, respectively, and 1 dex lower for Mg II. This result indicates that the outflow ejected by J1439B contains substantially fewer magnesium atoms than the local observations predict. Barring unaccounted observational errors, this discrepancy suggests that high-redshift outflows differ from local clumps of neutral gas in one or more properties:
-
Ionization correction. The ionization correction depends on the physical properties of the gas and is particularly uncertain for Na I, which traces a small fraction of Na atoms, since most are ionized (Murray et al. 2007; Baron et al. 2020). We directly confirm that Mg II is much more abundant than Mg I, consistent with theoretical expectations. Therefore, ionization corrections do not strongly affect the Mg calibration and likely do not affect Fe either, which has a similar ionization potential.
-
Elemental abundances. The gas is often assumed to have solar abundances, but the interstellar medium of high-redshift galaxies may have different chemical abundances compared to the solar neighborhood. Stellar abundance measurements for z ∼ 2 massive quiescent galaxies reveal an iron deficiency (−0.6 < [Fe/H] < 0) and an enhancement in [Mg/Fe], corresponding to roughly solar [Mg/H] values (Beverage et al. 2024, 2025; Jafariyazani et al. 2025). In one notable case, magnesium is strongly enhanced, with [Mg/H] ∼ 0.8 (Jafariyazani et al. 2020). If the gas ejected by J1439B was enriched in Mg, Equation (1) would predict a hydrogen-to-magnesium column density ratio below log NH I/NMg II ∼ 5.3, increasing the discrepancy with our empirically determined value of log NH I/NMg II ∼ 6.3. Moreover, abundance of the gas ejected in the outflow may not be representative of that in the galaxy.
-
Dust depletion. Dust depletion is perhaps the most uncertain ingredient in the local calibration. In Milky Way measurements, Na depletion exhibits a large scatter of 0.5 dex (Wakker & Mathis 2000). For Mg and Fe, the scatter is smaller, but the depletion depends strongly on the gas density, varying by more than 1 dex between different lines of sight (Jenkins 2009; De Cia et al. 2016). Therefore, our assumption of a linear relation between the hydrogen and the metal column densities may not hold if dust depletion systematically varies with gas density and column density. Although Fe depletion in our system appears consistent with the typical values found in the Milky Way (as already noted by Srianand et al. 2008), the low observed Mg column density may result from stronger Mg depletion onto dust grains. This implies dust-to-metal ratios exceeding those observed in the Milky Way, the Large Magellanic Cloud (Roman-Duval et al. 2021), or local galaxies (De Vis et al. 2019).
We conclude that dust depletion is the most plausible explanation for the discrepancy between the local calibration and our high-z empirical calibration. Specifically, the agreement between the calibrations for Na and Fe, combined with the disagreement for Mg, is consistent with a strong Mg dust depletion because of a high dust-to-metal ratio. Recent theoretical work supports this scenario. Using the SIMBA cosmological simulation with a realistic dust model, Lorenzon et al. (2025) show that roughly 20% of z ∼ 1 − 2 quiescent galaxies experiencing strong AGN-driven feedback exhibit elevated dust-to-metal ratios compared to local analogs. Such systems may act as reservoirs of large grains, which they expel to circumgalactic distances, where their large size ensures prolonged survival (Hirashita 2024; Richie et al. 2024). Therefore, strong Mg depletion may naturally result from accretion onto preexisting grains in dense, relatively cool gas. The complexity of the physical processes suggests that the conditions of high-redshift outflows differ from those in the local Universe.
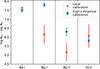 |
Fig. 5. Column density calibrations for different species. The local calibration based on Milky Way gas clouds is shown in red, with error bar indicating the range due to variations in dust depletion. Our empirical calibration derived from J1439B is shown in blue. The two calibrations agree for Na and Fe, but differ for Mg, suggesting stronger Mg dust depletion in high-redshift outflows compared to the Milky Way. |
Comparison between high-z empirical and local calibrations.
The most important caveat in our work is that we derive the empirical calibrations for a single line of sight in only one system. Considering the discrepancy with the local calibrations and the possible range of dust depletion and other relevant physical properties, we conclude that our Na I and Fe II calibrations yield at least the correct order of magnitude for the hydrogen column density. Future work must extend this analysis to a wider sample of outflows in high-redshift massive galaxies to assess the robustness and precision of the calibration.
Despite the remaining systematic uncertainties, our measurements confirm that previous estimates of neutral gas based on resonant metal lines are likely accurate within an order of magnitude. This finding is particularly important for the interpretation of recent JWST observations of massive quiescent galaxies at high redshift (Belli et al. 2024; D’Eugenio et al. 2024; Wu 2025). Our new calibrations confirm that neutral-phase mass outflow rates exceed those of the ionized-phase. These outflows reach levels sufficient to deplete the cold gas reservoir rapidly, explaining the observed quenching of star formation.
Acknowledgments
SB and AHK are supported by the ERC grant 101076080 “RED CARDINAL”. DD acknowledges support from the NCN through the SONATA grant UMO2020/39/D/ST9/00720 and support from the Polish National Agency for Academic Exchange (Bekker grant BPN/BEK/2024/1/00029/DEC/1). This article includes data gathered with the Magellan Telescopes located at Las Campanas Observatory, Chile, as well as observations collected at the European Organisation for Astronomical Research in the Southern Hemisphere under ESO program 278.A-5062(A) and obtained from the ESO Science Archive Facility.
References
- Baldwin, J. A., Phillips, M. M., & Terlevich, R. 1981, PASP, 93, 5 [Google Scholar]
- Barfety, C., Jolly, J.-B., Förster Schreiber, N. M., et al. 2025, ApJ, 988, 55 [Google Scholar]
- Baron, D., Netzer, H., Davies, R. I., & Xavier Prochaska, J. 2020, MNRAS, 494, 5396 [NASA ADS] [CrossRef] [Google Scholar]
- Belli, S., Park, M., Davies, R. L., et al. 2024, Nature, 630, 54 [NASA ADS] [CrossRef] [Google Scholar]
- Beverage, A. G., Kriek, M., Suess, K. A., et al. 2024, ApJ, 966, 234 [Google Scholar]
- Beverage, A. G., Slob, M., Kriek, M., et al. 2025, ApJ, 979, 249 [Google Scholar]
- Bouché, N., Hohensee, W., Vargas, R., et al. 2012, MNRAS, 426, 801 [CrossRef] [Google Scholar]
- Calzetti, D., Armus, L., Bohlin, R. C., et al. 2000, ApJ, 533, 682 [NASA ADS] [CrossRef] [Google Scholar]
- Chabrier, G. 2003, PASP, 115, 763 [Google Scholar]
- Cicone, C., Brusa, M., Ramos Almeida, C., et al. 2018, Nat. Astron., 2, 176 [Google Scholar]
- Concas, A., Maiolino, R., Curti, M., et al. 2022, MNRAS, 513, 2535 [NASA ADS] [CrossRef] [Google Scholar]
- Conroy, C., & Gunn, J. E. 2010, ApJ, 712, 833 [Google Scholar]
- Conroy, C., Gunn, J. E., & White, M. 2009, ApJ, 699, 486 [Google Scholar]
- Davies, R. L., Belli, S., Park, M., et al. 2024, MNRAS, 528, 4976 [CrossRef] [Google Scholar]
- De Cia, A., Ledoux, C., Mattsson, L., et al. 2016, A&A, 596, A97 [NASA ADS] [CrossRef] [EDP Sciences] [Google Scholar]
- De Vis, P., Jones, A., Viaene, S., et al. 2019, A&A, 623, A5 [NASA ADS] [CrossRef] [EDP Sciences] [Google Scholar]
- D’Eugenio, F., Pérez-González, P. G., Maiolino, R., et al. 2024, Nat. Astron., 8, 1443 [CrossRef] [Google Scholar]
- Draine, B. T. 2011, Physics of the Interstellar and Intergalactic Medium (Princeton: Princeton University Press) [Google Scholar]
- Förster Schreiber, N. M., & Wuyts, S. 2020, ARA&A, 58, 661 [Google Scholar]
- Förster Schreiber, N. M., Genzel, R., Newman, S. F., et al. 2014, ApJ, 787, 38 [Google Scholar]
- Gagné, J., Lambrides, E., Faherty, J. K., & Simcoe, R. 2015, https://doi.org/10.5281/zenodo.18775 [Google Scholar]
- Goerdt, T., & Ceverino, D. 2015, MNRAS, 450, 3359 [NASA ADS] [CrossRef] [Google Scholar]
- Harrison, C. M. 2017, Nat. Astron., 1, 0165 [NASA ADS] [CrossRef] [Google Scholar]
- Herrera-Camus, R., Tacconi, L., Genzel, R., et al. 2019, ApJ, 871, 37 [NASA ADS] [CrossRef] [Google Scholar]
- Hirashita, H. 2024, PASJ, 76, 753 [Google Scholar]
- Jafariyazani, M., Newman, A. B., Mobasher, B., et al. 2020, ApJ, 897, L42 [NASA ADS] [CrossRef] [Google Scholar]
- Jafariyazani, M., Newman, A. B., Mobasher, B., et al. 2025, ApJ, 986, 148 [Google Scholar]
- Jenkins, E. B. 2009, ApJ, 700, 1299 [Google Scholar]
- Johnson, B. D., Leja, J., Conroy, C., & Speagle, J. S. 2021, ApJ, 254, 22 [Google Scholar]
- Kennicutt, R. C. 1998, ARA&A, 36, 189 [NASA ADS] [CrossRef] [Google Scholar]
- Kriek, M., & Conroy, C. 2013, ApJ, 775, L16 [NASA ADS] [CrossRef] [Google Scholar]
- Kriek, M., van Dokkum, P. G., Labbé, I., et al. 2009, ApJ, 700, 221 [Google Scholar]
- Lamperti, I., Harrison, C. M., Mainieri, V., et al. 2021, A&A, 654, A90 [NASA ADS] [CrossRef] [EDP Sciences] [Google Scholar]
- Leja, J., Johnson, B. D., Conroy, C., & van Dokkum, P. 2018, ApJ, 854, 62 [NASA ADS] [CrossRef] [Google Scholar]
- Leja, J., Carnall, A. C., Johnson, B. D., Conroy, C., & Speagle, J. S. 2019, ApJ, 876, 3 [Google Scholar]
- Leja, J., Speagle, J. S., Ting, Y.-S., et al. 2022, ApJ, 936, 165 [NASA ADS] [CrossRef] [Google Scholar]
- Liboni, C., Belli, S., Bugiani, L., et al. 2026, A&A, 705, A125 [NASA ADS] [CrossRef] [EDP Sciences] [Google Scholar]
- Lorenzon, G., Donevski, D., Lisiecki, K., et al. 2025, A&A, 693, A118 [NASA ADS] [CrossRef] [EDP Sciences] [Google Scholar]
- Maltby, D. T., Almaini, O., McLure, R. J., et al. 2019, MNRAS, 489, 1139 [Google Scholar]
- Man, A. W. S., Zabl, J., Brammer, G. B., et al. 2021, ApJ, 919, 20 [NASA ADS] [CrossRef] [Google Scholar]
- Martin, C. L., Ho, S. H., Kacprzak, G. G., & Churchill, C. W. 2019, ApJ, 878, 84 [NASA ADS] [CrossRef] [Google Scholar]
- Murray, N., Martin, C. L., Quataert, E., & Thompson, T. A. 2007, ApJ, 660, 211 [NASA ADS] [CrossRef] [Google Scholar]
- Nelson, D., Genel, S., Pillepich, A., et al. 2016, MNRAS, 460, 2881 [NASA ADS] [CrossRef] [Google Scholar]
- Noterdaeme, P., Petitjean, P., Ledoux, C., Srianand, R., & Ivanchik, A. 2008, A&A, 491, 397 [NASA ADS] [CrossRef] [EDP Sciences] [Google Scholar]
- Park, M., Belli, S., Conroy, C., et al. 2024, ApJ, 976, 72 [Google Scholar]
- Pettini, M., Rix, S. A., Steidel, C. C., et al. 2002, ApJ, 569, 742 [NASA ADS] [CrossRef] [Google Scholar]
- Richie, H. M., Schneider, E. E., Abruzzo, M. W., & Torrey, P. 2024, ApJ, 974, 81 [NASA ADS] [CrossRef] [Google Scholar]
- Roman-Duval, J., Jenkins, E. B., Tchernyshyov, K., et al. 2021, ApJ, 910, 95 [NASA ADS] [CrossRef] [Google Scholar]
- Rudie, G. C., Newman, A. B., & Murphy, M. T. 2017, ApJ, 843, 98 [Google Scholar]
- Rupke, D. S., Veilleux, S., & Sanders, D. B. 2002, ApJ, 570, 588 [NASA ADS] [CrossRef] [Google Scholar]
- Rupke, D. S., Veilleux, S., & Sanders, D. B. 2005, ApJS, 160, 87 [NASA ADS] [CrossRef] [Google Scholar]
- Savage, B. D., & Sembach, K. R. 1996, ARA&A, 34, 279 [Google Scholar]
- Schroetter, I., Bouché, N. F., Zabl, J., et al. 2019, MNRAS, 490, 4368 [CrossRef] [Google Scholar]
- Shivaei, I., Reddy, N. A., Shapley, A. E., et al. 2015, ApJ, 815, 98 [NASA ADS] [CrossRef] [Google Scholar]
- Speagle, J. S. 2020, MNRAS, 493, 3132 [Google Scholar]
- Spilker, J. S., Phadke, K. A., Aravena, M., et al. 2020, ApJ, 905, 85 [Google Scholar]
- Srianand, R., Noterdaeme, P., Ledoux, C., & Petitjean, P. 2008, A&A, 482, L39 [NASA ADS] [CrossRef] [EDP Sciences] [Google Scholar]
- Steidel, C. C., Erb, D. K., Shapley, A. E., et al. 2010, ApJ, 717, 289 [Google Scholar]
- Sun, Y., Ji, Z., Rieke, G. H., et al. 2026, ApJ, 997, 140 [Google Scholar]
- Taylor, E., Maltby, D., Almaini, O., et al. 2024, MNRAS, 535, 1684 [Google Scholar]
- Tremonti, C. A., Moustakas, J., & Diamond-Stanic, A. M. 2007, ApJ, 663, L77 [NASA ADS] [CrossRef] [Google Scholar]
- Vacca, W. D., Cushing, M. C., & Rayner, J. T. 2003, PASP, 115, 389 [NASA ADS] [CrossRef] [Google Scholar]
- Valentino, F., Heintz, K. E., Brammer, G., et al. 2025, A&A, 699, A358 [NASA ADS] [CrossRef] [EDP Sciences] [Google Scholar]
- Veilleux, S., Maiolino, R., Bolatto, A. D., & Aalto, S. 2020, A&ARv, 28, 2 [NASA ADS] [CrossRef] [Google Scholar]
- Wakker, B. P., & Mathis, J. S. 2000, ApJ, 544, L107 [CrossRef] [Google Scholar]
- Wu, P.-F. 2025, ApJ, 978, 131 [Google Scholar]
Appendix A: Measurements
Tables A.1, A.2, A.3, and A.4 report the EW measurements and corresponding column densities for transitions observed in the FIRE spectrum.
Na I equivalent width and column density
Mg II equivalent widths and column densities
Mg I equivalent width and column density
Fe II equivalent widths and column densities
All Tables
All Figures
|
Fig. 1. Artistic illustration of galaxy J1439B and its outflow. The outflow appears as a sub-DLA in the spectrum of the background quasar J1439+1117. |
| In the text | |
|
Fig. 2. Spectral energy distribution (SED) fit to the broadband photometry of galaxy J1439B. The blue line represents the model spectrum, red squares represent the best-fit model photometry, and black circles with error bars indicate the observed photometry. |
| In the text | |
|
Fig. 3. Magellan/FIRE spectrum of QSO J1439+1117 (blue; smoothed with a 4-pixel Gaussian kernel) and spectral uncertainty (orange). Dashed red lines mark the main QSO emission lines at z = 2.585, while dashed green lines mark sub-DLA absorption lines at z = 2.41837. Spectral windows with poor atmospheric transmission are marked in gray. |
| In the text | |
|
Fig. 4. Absorption features in the QSO J1439+1117 spectrum in velocity space, with zero corresponding to the systemic velocity of galaxy J1439B. Normalized flux is shown on the y axis of each panel. Top panels: Fe II, Mg II, Mg I, and Na I transitions in the FIRE spectrum. The shaded areas represent the spectral regions used for EW calculations of the component at −47 km/s (shaded blue areas), or for the sum of the components at −47 and −164 km/s, when blended (shaded red areas). Bottom panels: O I, Fe II, and Al II in the higher-resolution UVES data. Vertical dashed lines mark the absorbers used to fit the H I distribution in Srianand et al. (2008) and Noterdaeme et al. (2008). |
| In the text | |
|
Fig. 5. Column density calibrations for different species. The local calibration based on Milky Way gas clouds is shown in red, with error bar indicating the range due to variations in dust depletion. Our empirical calibration derived from J1439B is shown in blue. The two calibrations agree for Na and Fe, but differ for Mg, suggesting stronger Mg dust depletion in high-redshift outflows compared to the Milky Way. |
| In the text | |
Current usage metrics show cumulative count of Article Views (full-text article views including HTML views, PDF and ePub downloads, according to the available data) and Abstracts Views on Vision4Press platform.
Data correspond to usage on the plateform after 2015. The current usage metrics is available 48-96 hours after online publication and is updated daily on week days.
Initial download of the metrics may take a while.