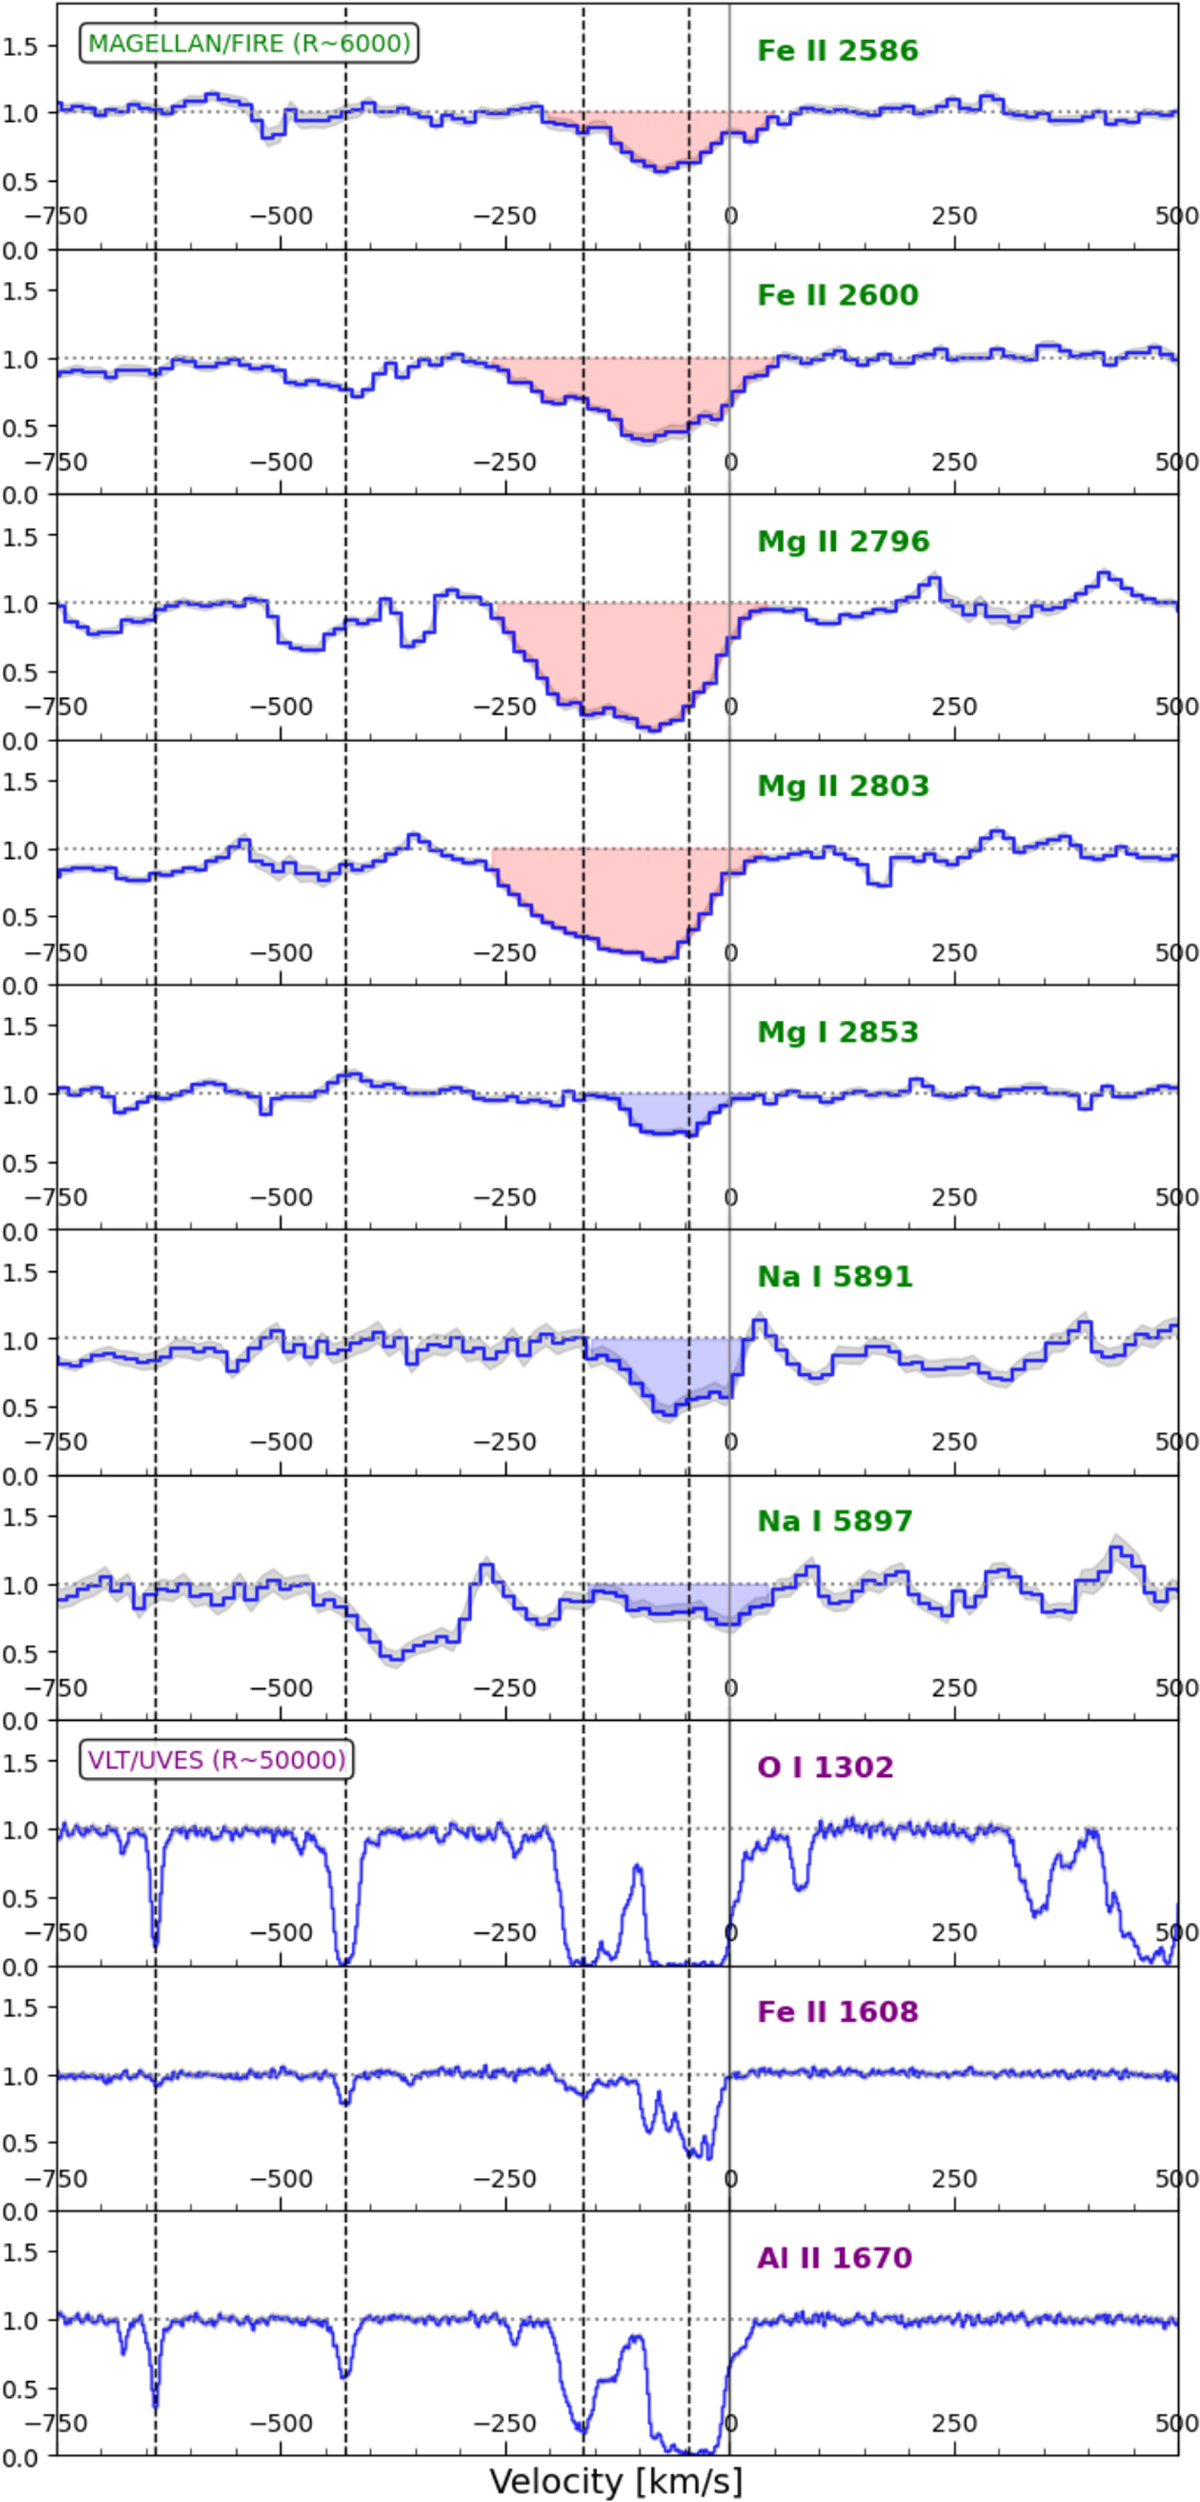
Fig. 4.
Download original image
Absorption features in the QSO J1439+1117 spectrum in velocity space, with zero corresponding to the systemic velocity of galaxy J1439B. Normalized flux is shown on the y axis of each panel. Top panels: Fe II, Mg II, Mg I, and Na I transitions in the FIRE spectrum. The shaded areas represent the spectral regions used for EW calculations of the component at −47 km/s (shaded blue areas), or for the sum of the components at −47 and −164 km/s, when blended (shaded red areas). Bottom panels: O I, Fe II, and Al II in the higher-resolution UVES data. Vertical dashed lines mark the absorbers used to fit the H I distribution in Srianand et al. (2008) and Noterdaeme et al. (2008).
Current usage metrics show cumulative count of Article Views (full-text article views including HTML views, PDF and ePub downloads, according to the available data) and Abstracts Views on Vision4Press platform.
Data correspond to usage on the plateform after 2015. The current usage metrics is available 48-96 hours after online publication and is updated daily on week days.
Initial download of the metrics may take a while.