Fig. 1.
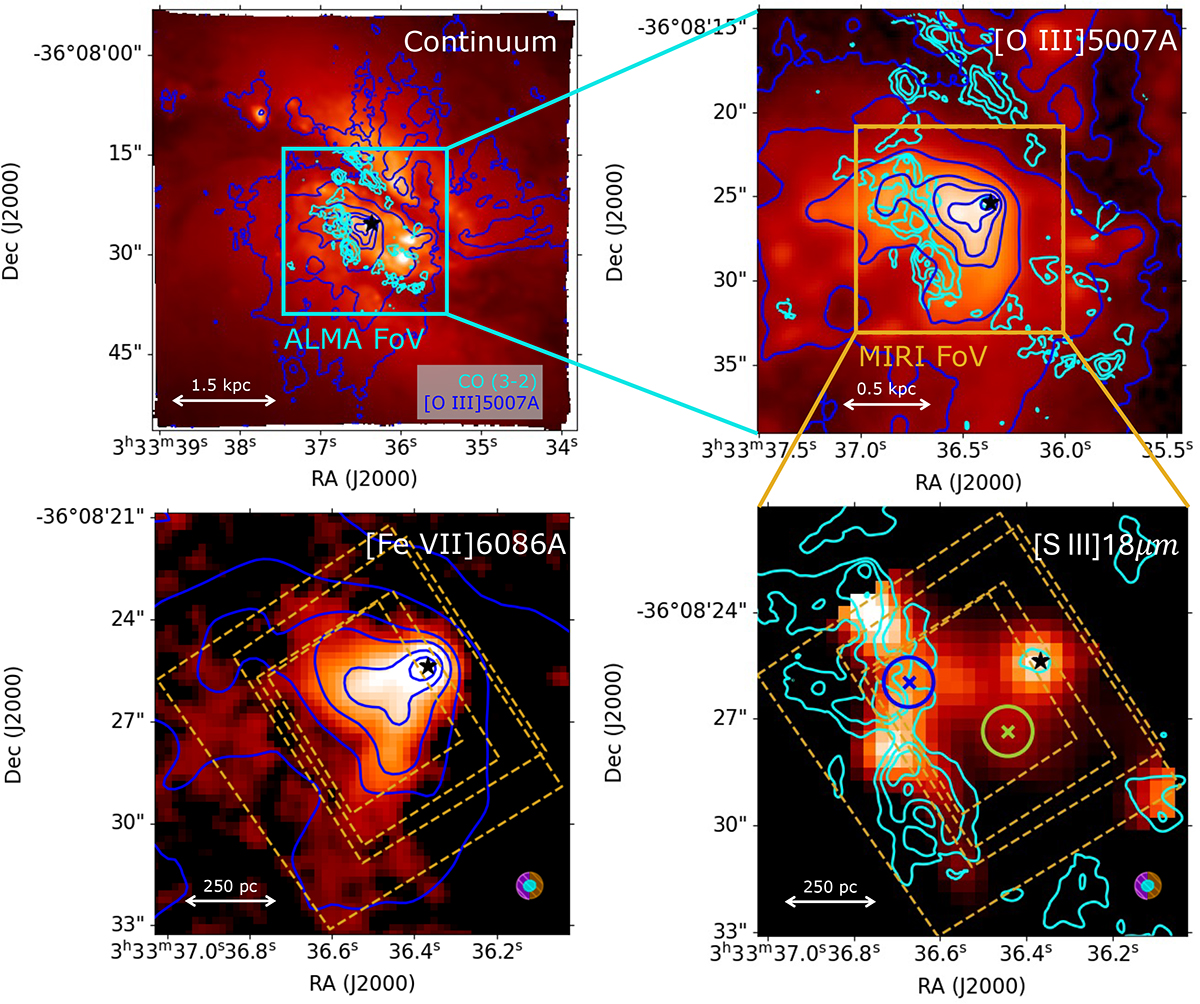
Download original image
MIRI, MUSE, and ALMA observations of NGC 1365. Upper left: Continuum map from MUSE data obtained collapsing the data in the wavelength range 5200–5800 Å. Upper right: [O III] λ5007 Å flux map from MUSE data in the ALMA FoV. Lower left: [Fe VII] λ6087 Å flux map from MUSE data in the MIRI Ch4 FoV. Lower right: [S III]18.51 μm flux map from MIRI data. Dashed orange rectangles represent the MIRI MRS channels FoV. Blue and green circles of radius of 0.7″ represent the regions from which we extracted the spectra shown in Fig. 2. Cyan and blue contours represent arbitrary levels of CO(3-2) flux from ALMA and [O III] λ5007 Å from MUSE, respectively. The star marks the position of the nucleus based on the ALMA data (see Section A.3). In the lower panels, the violet and orange circles represent the MUSE and MIRI PSF, respectively. The ALMA beam is shown as a cyan oval.
Current usage metrics show cumulative count of Article Views (full-text article views including HTML views, PDF and ePub downloads, according to the available data) and Abstracts Views on Vision4Press platform.
Data correspond to usage on the plateform after 2015. The current usage metrics is available 48-96 hours after online publication and is updated daily on week days.
Initial download of the metrics may take a while.