Open Access
Fig. B.1.
Download original image
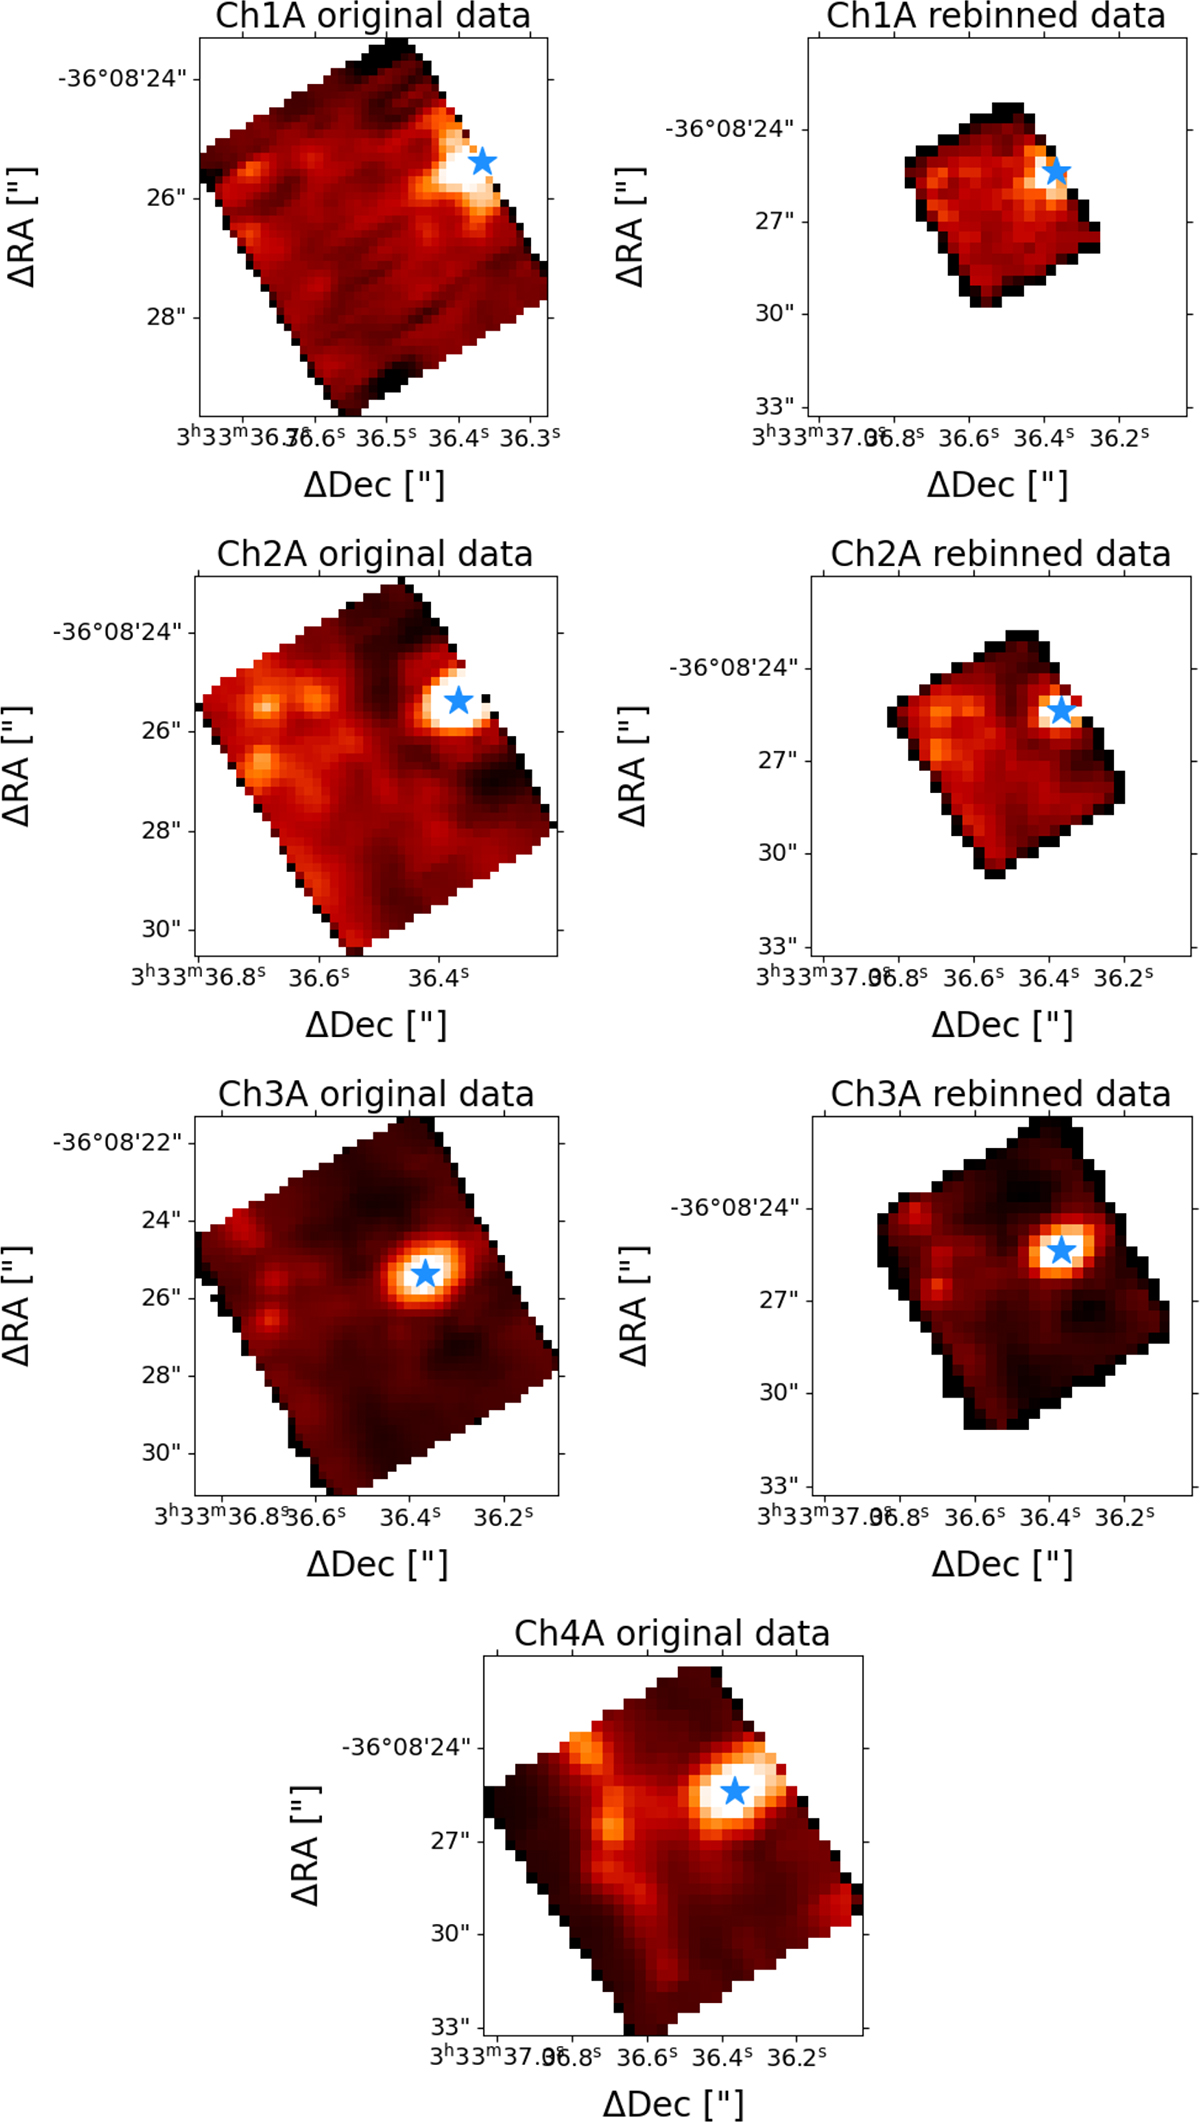
Examples of the rebinning procedure for datacubes in the A (SHORT) band. The first three rows compare the original collapsed data with native pixel size and FoV (left) to the rebinned data matched to the wider FoV of Ch4 (right). The bottom row shows the original Ch4 data. The star marks the nucleus position.
Current usage metrics show cumulative count of Article Views (full-text article views including HTML views, PDF and ePub downloads, according to the available data) and Abstracts Views on Vision4Press platform.
Data correspond to usage on the plateform after 2015. The current usage metrics is available 48-96 hours after online publication and is updated daily on week days.
Initial download of the metrics may take a while.