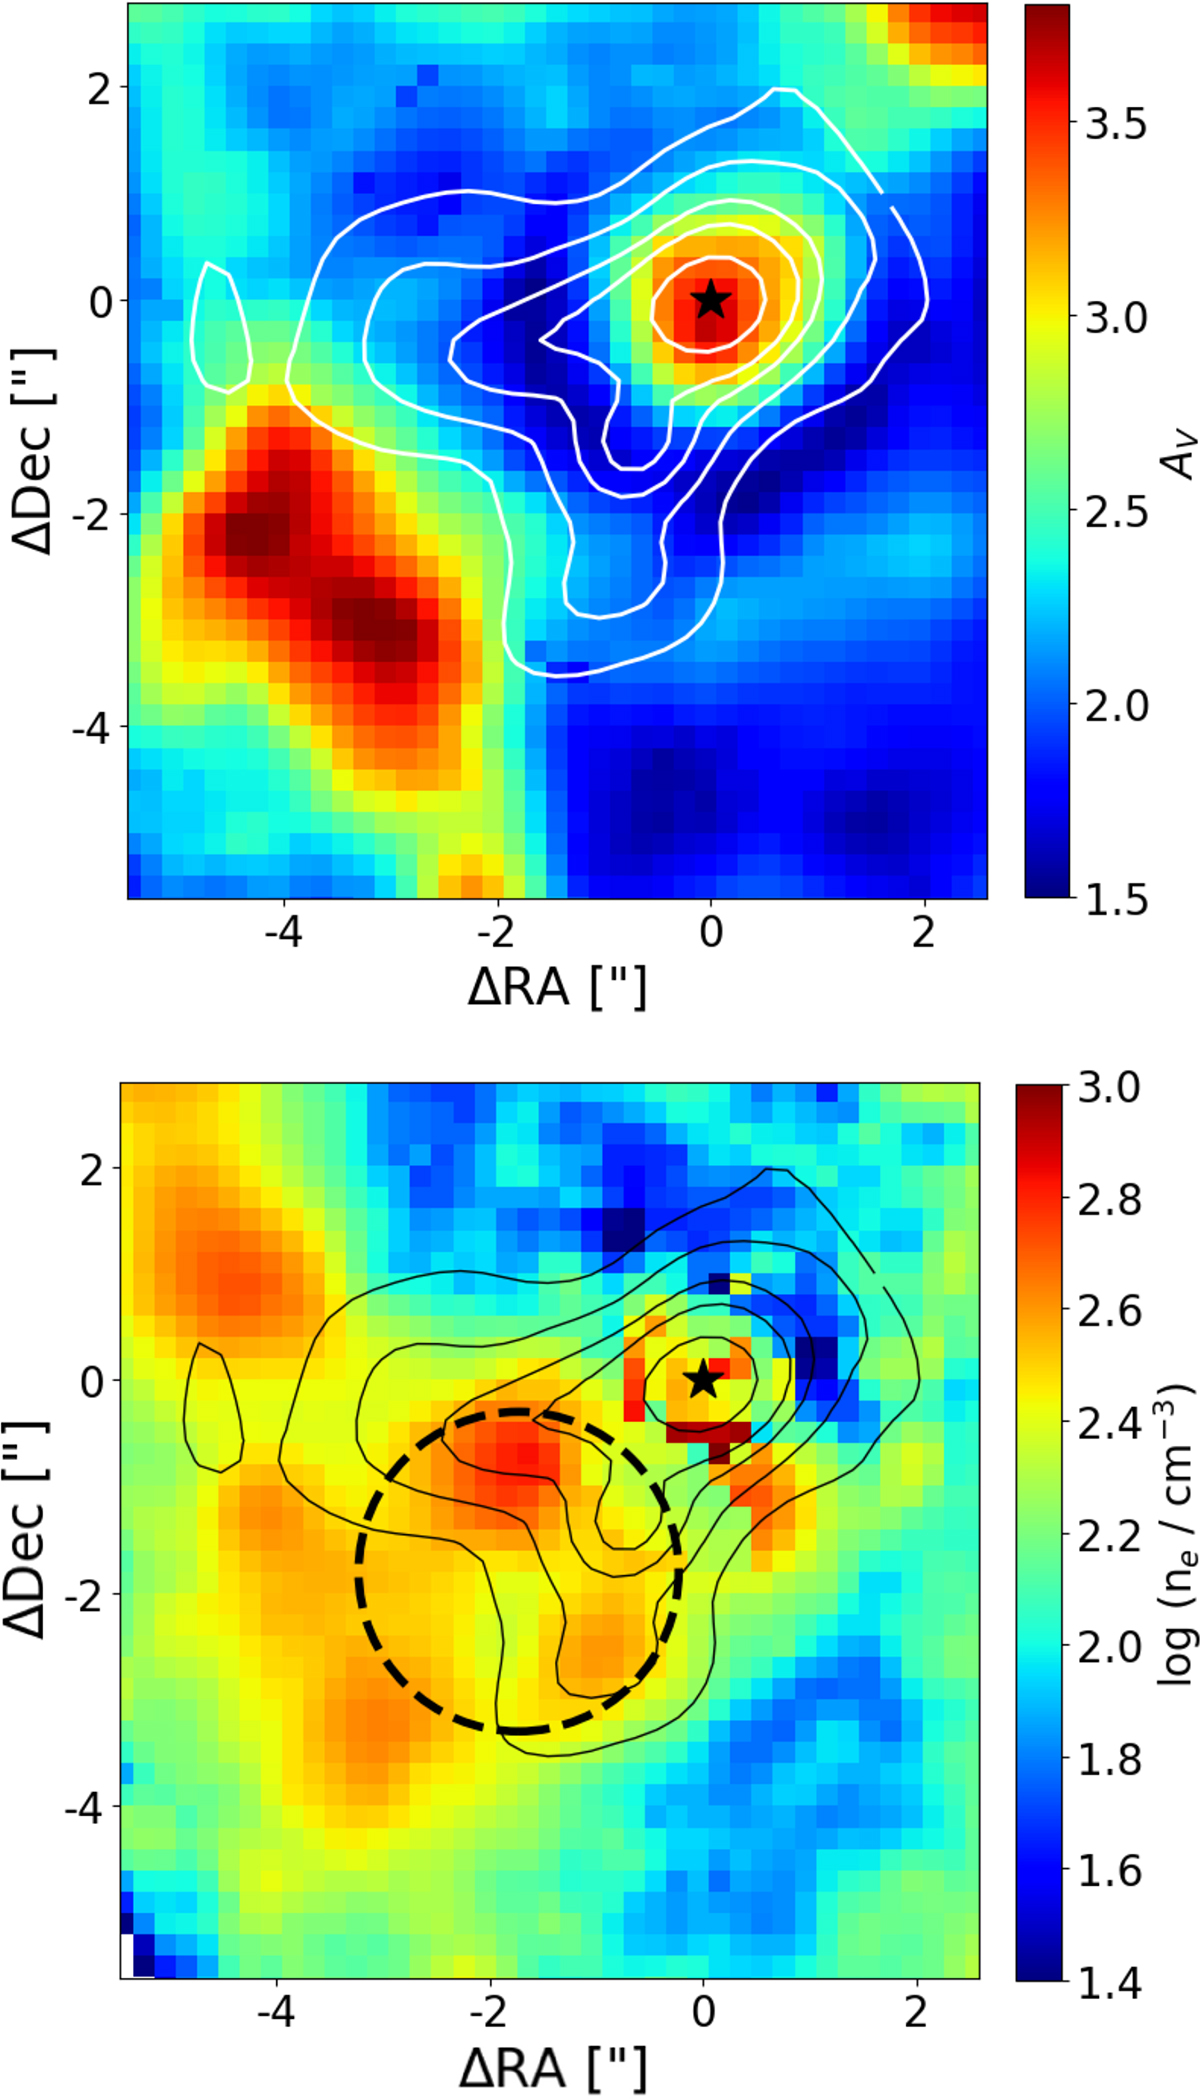
Fig. D.1.
Download original image
Spatially resolved maps of visual extinction and electron density in the circumnuclear region of NGC 1365 obtained from the MUSE data, zoomed in the MIRI FoV. Top panel: visual extinction computed from the Balmer decrement. Bottom panel: ionized gas electron density obtained from the [S II]λ6716/[S II]λ6731 line ratio. Contours represent arbitrary flux levels of [Ne V]λ14#x03BC;m. The black circle marks the 1.5″radius aperture used to extract integrated fluxes for the HOMERUN code (see Section 3.5). The star indicates the nucleus position.
Current usage metrics show cumulative count of Article Views (full-text article views including HTML views, PDF and ePub downloads, according to the available data) and Abstracts Views on Vision4Press platform.
Data correspond to usage on the plateform after 2015. The current usage metrics is available 48-96 hours after online publication and is updated daily on week days.
Initial download of the metrics may take a while.