Fig. 2.
Download original image
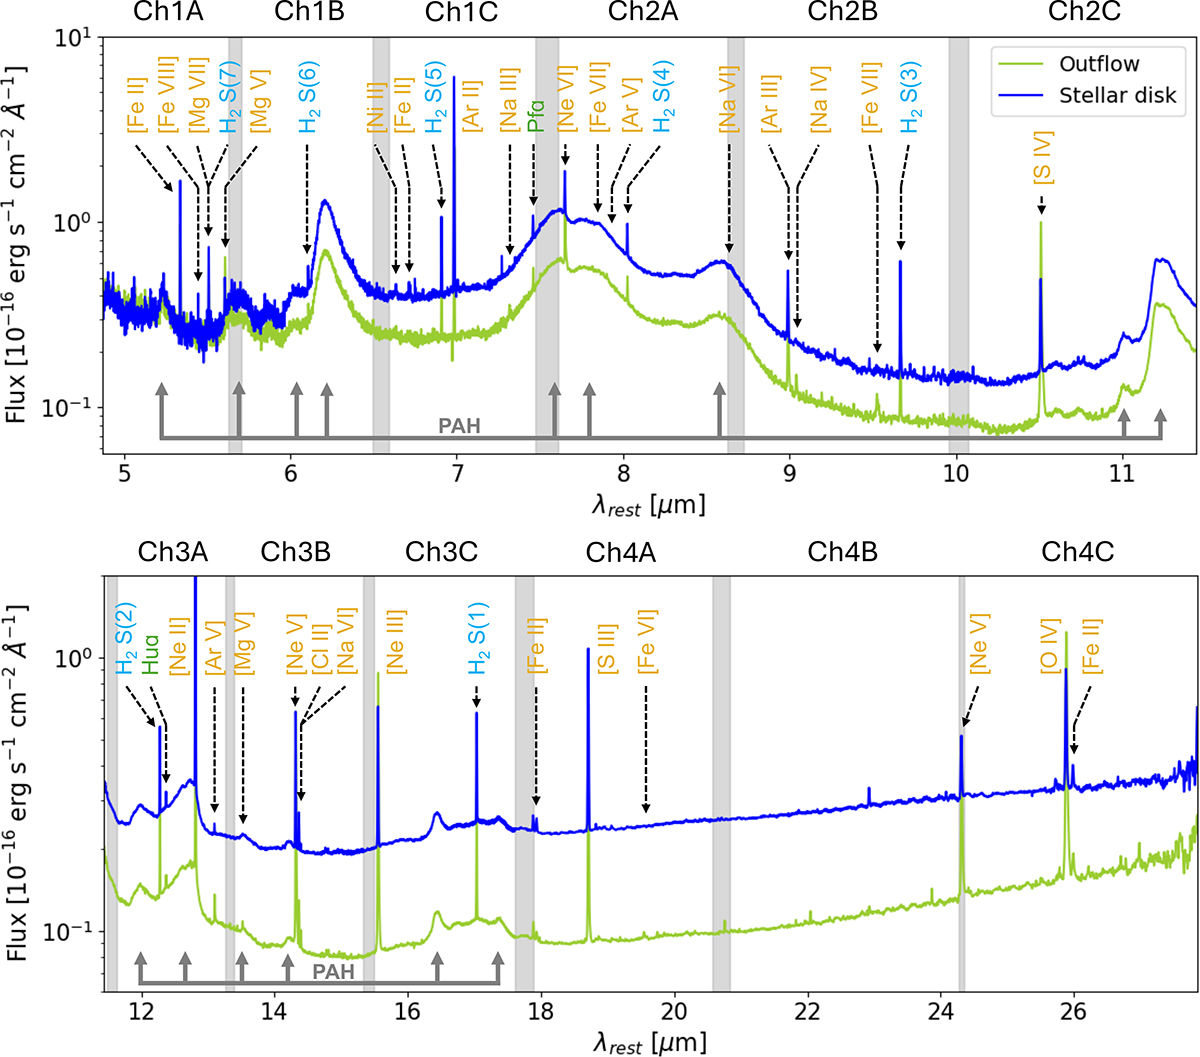
Integrated spectra of NGC 1365 from MIRI MRS data. The blue and green curves represent the integrated spectra extracted from the 0.7″ radius apertures marked by the circles in the lower right panel of Fig. 1. These apertures sample regions dominated by the stellar disk and outflow emission, respectively. Detected emission lines are marked with vertical lines: ionized gas emission lines are labeled in yellow, H2 rotational lines in cyan, and H I recombination lines in green. We annotate the main PAH features with gray arrows. The names of each MIRI MRS sub-channel are indicated, and the gray regions represent the overlapping spectral ranges of two adjacent sub-channels.
Current usage metrics show cumulative count of Article Views (full-text article views including HTML views, PDF and ePub downloads, according to the available data) and Abstracts Views on Vision4Press platform.
Data correspond to usage on the plateform after 2015. The current usage metrics is available 48-96 hours after online publication and is updated daily on week days.
Initial download of the metrics may take a while.