Fig. 3.
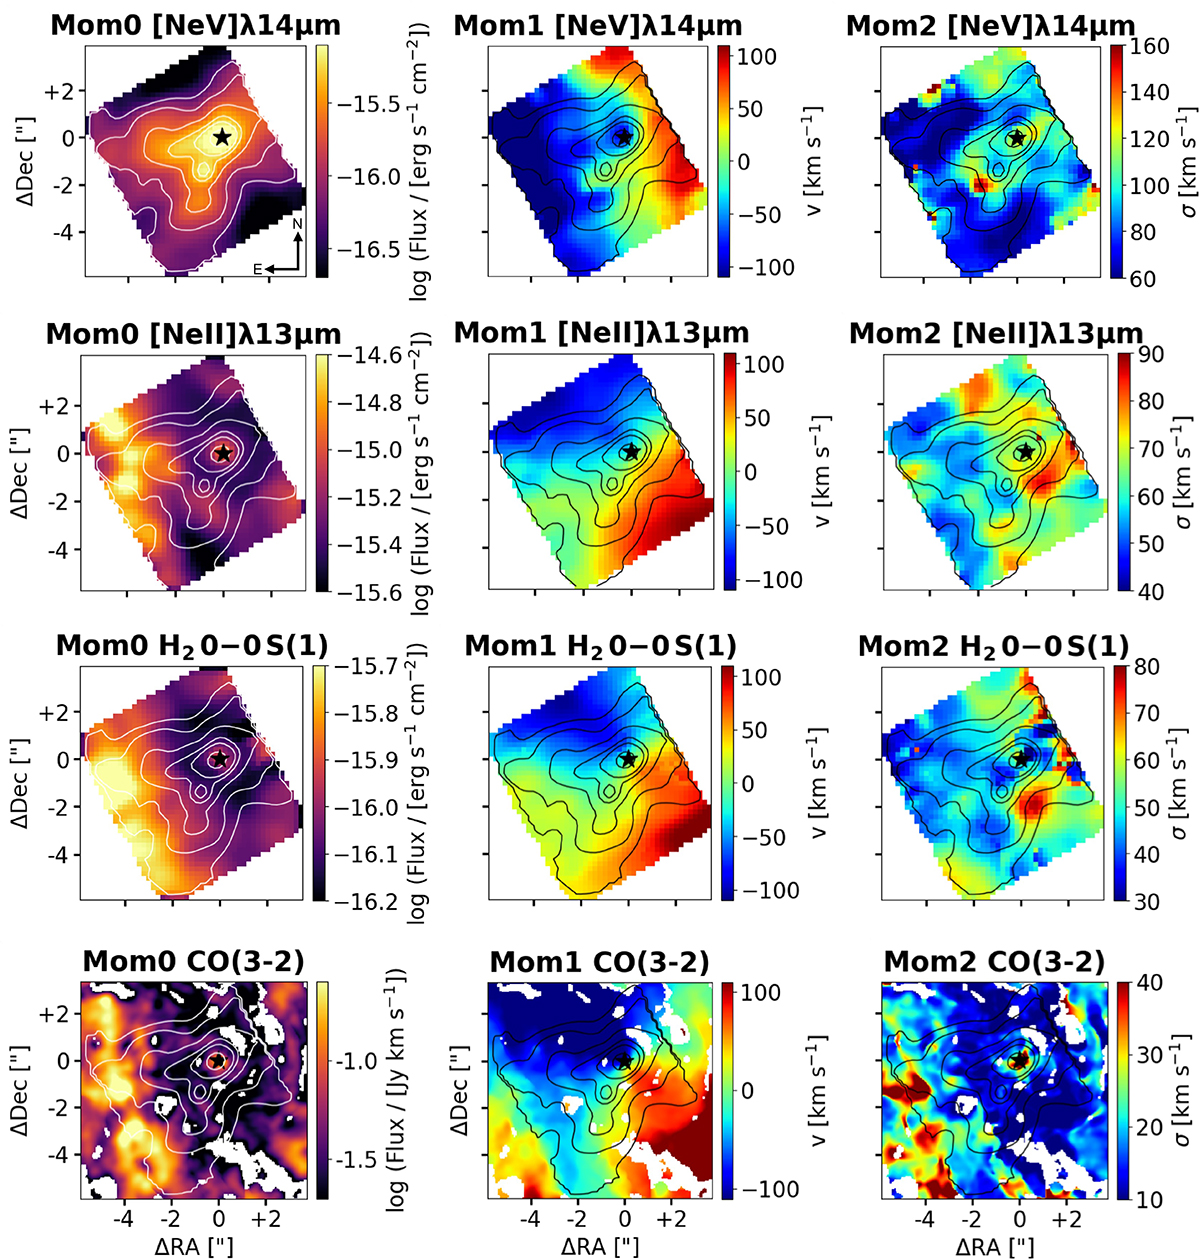
Download original image
Moment maps of ionized and molecular gas emission in NGC 1365, tracing both the rotating disk and the outflowing gas components. From top to bottom: [Ne V] λ14 μm, [Ne II] λ13 μm, H2 0 − 0 S(1), and CO(3-2) moment maps. From left to right, we show the flux, the line-of-sight velocity (LOSV), and the velocity dispersion map. The contours represent arbitrary flux levels of [Ne V] λ14 μm emission. The star marks the nucleus position. The maps size is 870 × 910 pc2. Spaxels with S/N < 5 are masked.
Current usage metrics show cumulative count of Article Views (full-text article views including HTML views, PDF and ePub downloads, according to the available data) and Abstracts Views on Vision4Press platform.
Data correspond to usage on the plateform after 2015. The current usage metrics is available 48-96 hours after online publication and is updated daily on week days.
Initial download of the metrics may take a while.