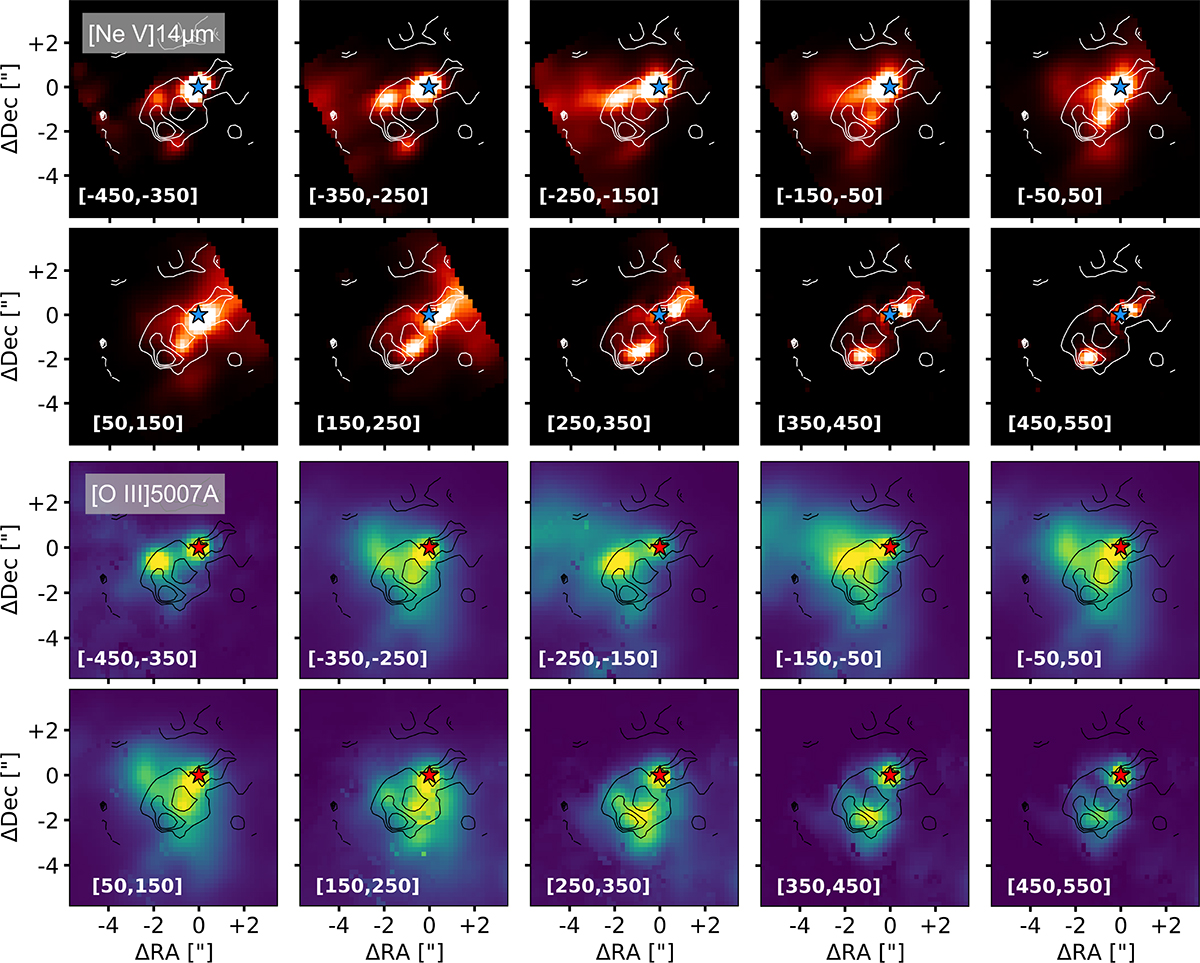
Fig. 4.
Download original image
Channel maps of ionized gas species tracing the outflow kinematics from MIRI and MUSE data. Upper panel: Channel maps of [Ne V] λ14 μm emission lines from MIRI data. Lower panel: Channel maps of [O III] λ5007 Å emission from WFM MUSE data. Contours indicate velocity dispersion levels of 97, 114, and 130 km s−1 in the [Ne V] λ14 μm emission. Velocity bins are indicated at the top of every panel in kilometers per second and are computed relative to the same systemic velocity. The star marks the position of the nucleus based on the ALMA data (see Appendix A.3).
Current usage metrics show cumulative count of Article Views (full-text article views including HTML views, PDF and ePub downloads, according to the available data) and Abstracts Views on Vision4Press platform.
Data correspond to usage on the plateform after 2015. The current usage metrics is available 48-96 hours after online publication and is updated daily on week days.
Initial download of the metrics may take a while.