Fig. 5.
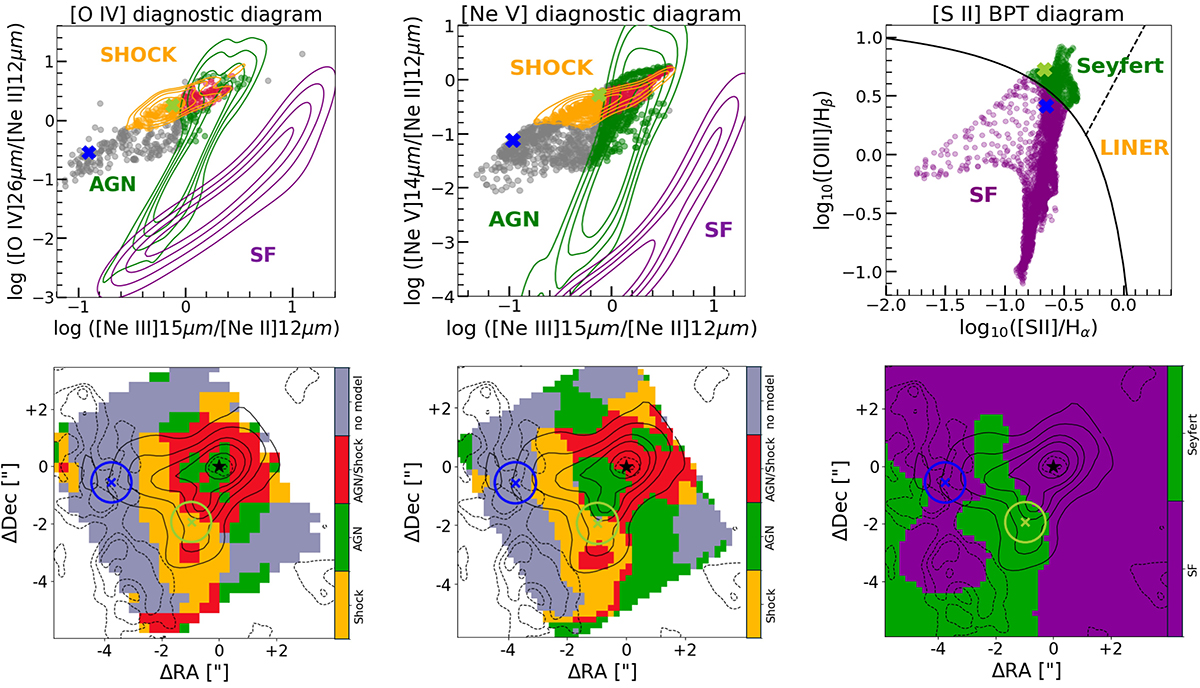
Download original image
Comparison between mid-IR and optical diagnostic diagrams. Top panels, from left to right: Diagnostic diagram of [Ne III] λ15 μm/[Ne II] λ12 μm vs. [O IV] λ14 μm/[Ne II] λ12 μm, [Ne III] λ15 μm/[Ne II] λ12 μm vs. [Ne V] λ14 μm/[Ne II] λ12 μm, and [S II] λλ6716, 6731/Hα vs. [O III] λ5007 Å/Hβ. In the mid-IR diagnostic diagrams, data points are color-coded by their proximity to the SF-, AGN-, and shocks-excitation models, based on the predictions by Feltre et al. (2023). In the [S II] BPT diagram, the solid curve defines the theoretical upper bound for pure SF (Kewley et al. 2001), while the dashed one separates Seyfert galaxies from LINERs (Kewley et al. 2006). The lower panels show spatially resolved excitation maps, where each pixel is color-coded based on its position in the corresponding diagnostic diagram. In the mid-IR diagnostic diagrams, shock-excited spaxels are in orange, AGN-excited spaxels in green, overlapping spaxels are in red, and spaxels not reproducible with any single model are in gray. In the [S II] BPT diagram, Seyfert-excited spaxels are in green, and SF-excited spaxels are in purple. Solid black contours represent arbitrary [Ne V] λ14 μm flux levels, while dashed black contours represent arbitrary levels of CO(3-2) flux from ALMA data. Circles are the regions where colored crosses in the upper panels and spectra in Fig. 2 are extracted from, integrated with a radius of 0.7″. The star marks the position of the nucleus based on the ALMA data (see Appendix A.3). Spaxels with S/N < 10 are masked.
Current usage metrics show cumulative count of Article Views (full-text article views including HTML views, PDF and ePub downloads, according to the available data) and Abstracts Views on Vision4Press platform.
Data correspond to usage on the plateform after 2015. The current usage metrics is available 48-96 hours after online publication and is updated daily on week days.
Initial download of the metrics may take a while.