Fig. 6.
Download original image
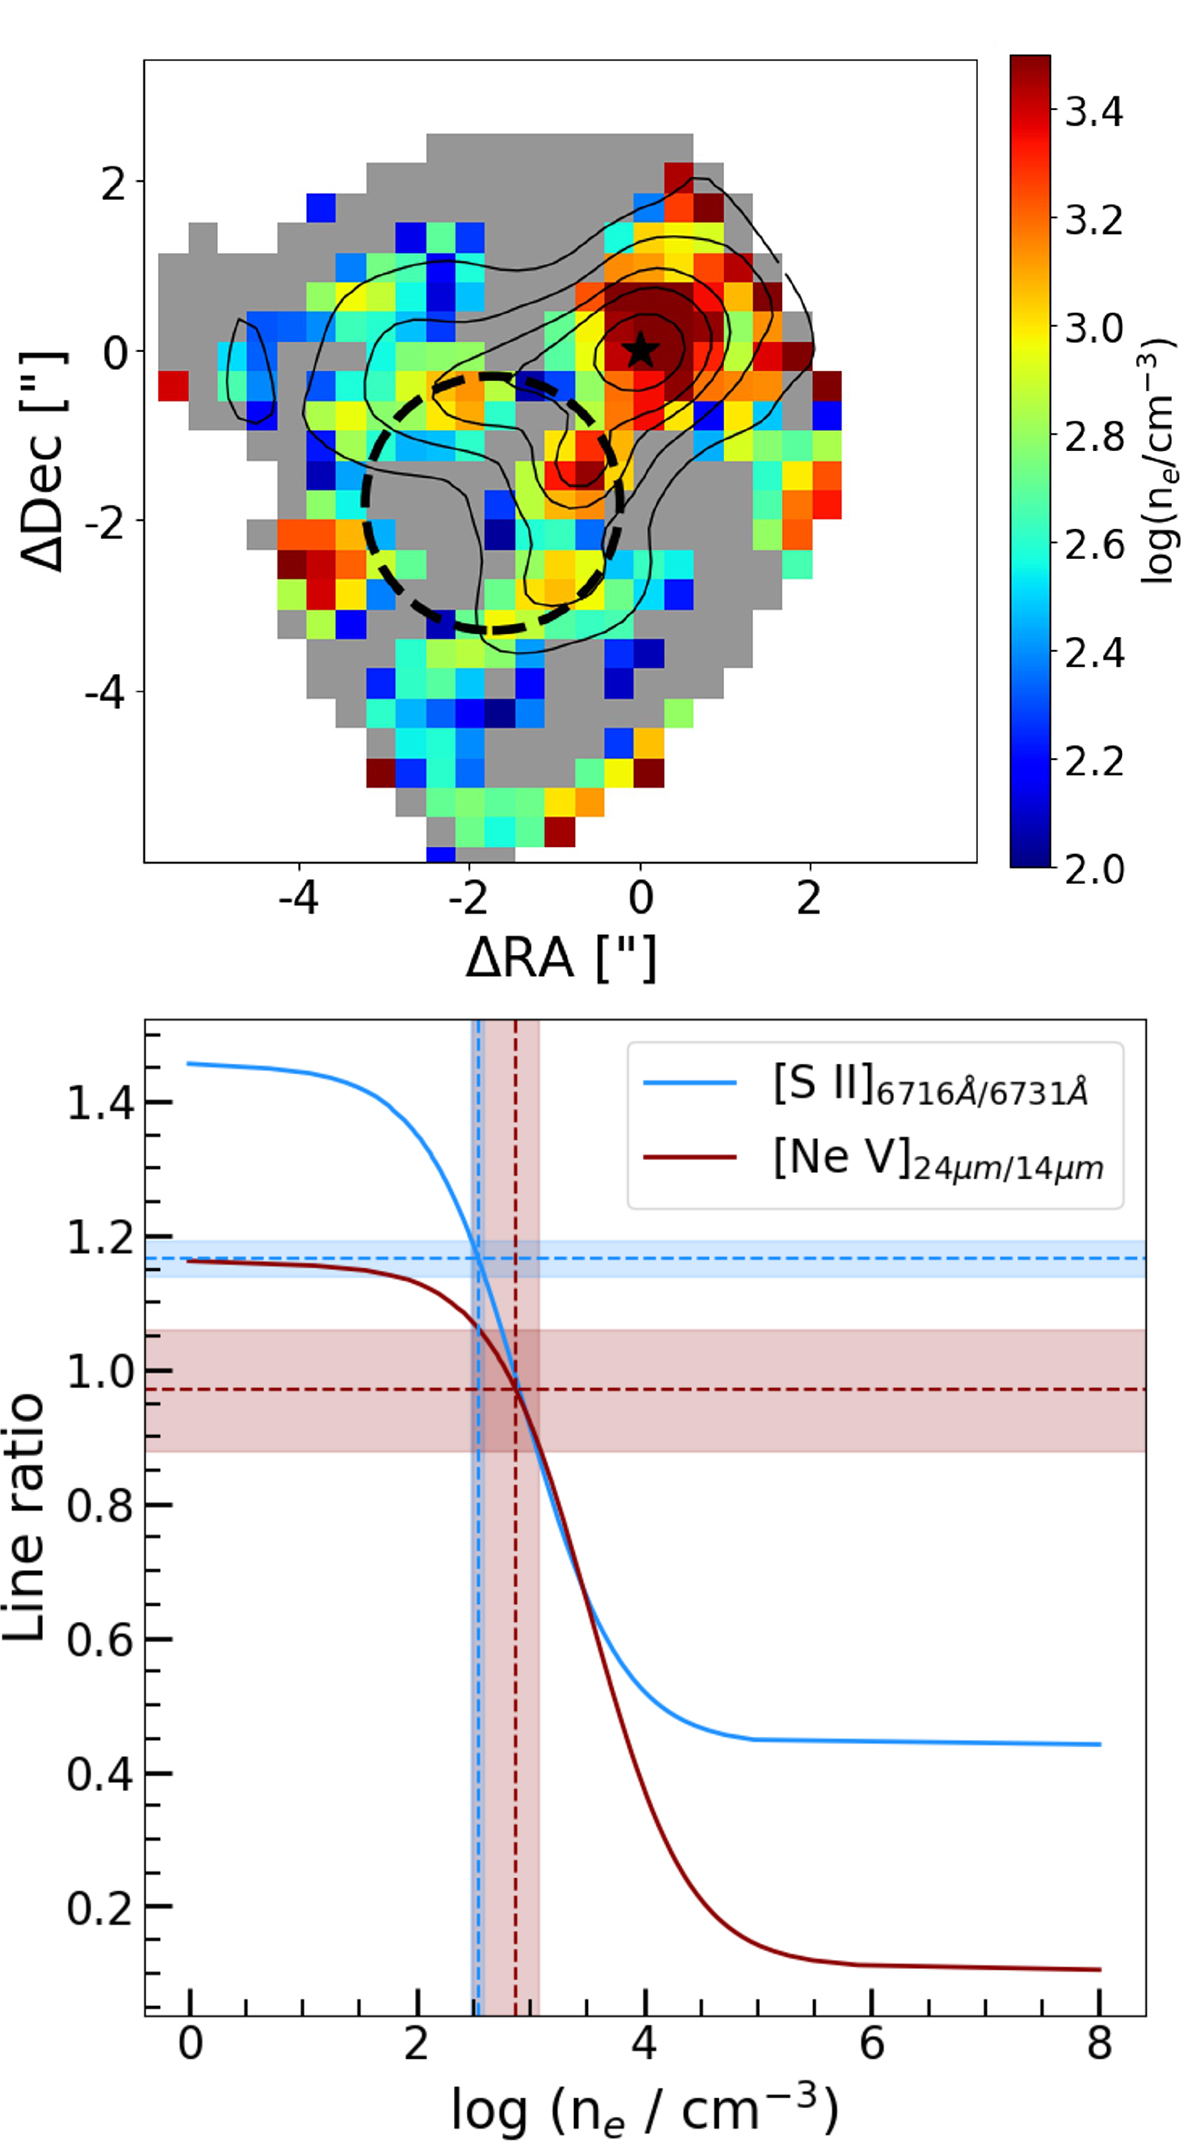
Density map from [Ne V] and comparison with [S II]-based values. Top panel: Electron density map derived from the [Ne V] λ24 μm/[Ne V] λ14 μm line ratio. Gray pixels indicate regions where the observed ratio exceeds the theoretical low-density limit (LDL) of ∼1.2. In these spaxels, we can assume an upper limit for the density of log(ne/cm−3) ≤ 2. Black contours trace arbitrary flux levels of [Ne V] λ14 μm emission. The black circle marks the 1.5″ radius aperture used to extract integrated densities from [S II] and [Ne V]. Spaxels with S/N < 10 are masked out. Bottom panel: Theoretical [S II] and [Ne V] line ratios as a function of electron density, computed with PyNeb (Luridiana et al. 2015). Vertical dashed lines indicate the density values in the circular aperture inferred from the observed ratios (shown as horizontal dashed lines) and shaded regions represent the errors.
Current usage metrics show cumulative count of Article Views (full-text article views including HTML views, PDF and ePub downloads, according to the available data) and Abstracts Views on Vision4Press platform.
Data correspond to usage on the plateform after 2015. The current usage metrics is available 48-96 hours after online publication and is updated daily on week days.
Initial download of the metrics may take a while.