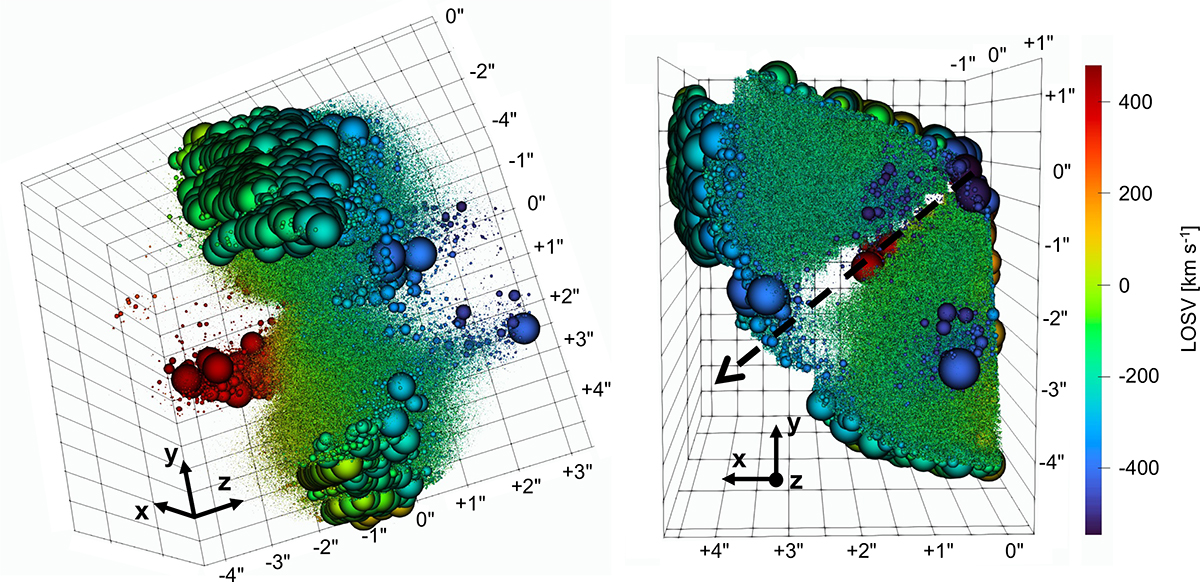
Fig. 8.
Download original image
Three-dimensional reconstruction of the MOKA3D best-fit model of the ionized outflow traced by [Ne V] λ14 μm. Gas clouds are color-coded by their LOSV. The two panels show different viewing angles: the left one provides a view into the inner cone region, while the right one corresponds to the observer’s line of sight. The XY plane represents the plane of the sky, with the Y and X axes oriented in the northern and eastern directions, respectively, while the Z axis corresponds to the line of sight. In the right panel, the dashed arrow indicate the direction of the conical outflow axis. According to the color bar, blue and red clouds are blueshifted and redshifted, respectively. Bubble size scales with the intrinsic flux of each cloud.
Current usage metrics show cumulative count of Article Views (full-text article views including HTML views, PDF and ePub downloads, according to the available data) and Abstracts Views on Vision4Press platform.
Data correspond to usage on the plateform after 2015. The current usage metrics is available 48-96 hours after online publication and is updated daily on week days.
Initial download of the metrics may take a while.