Fig. A.1.
Download original image
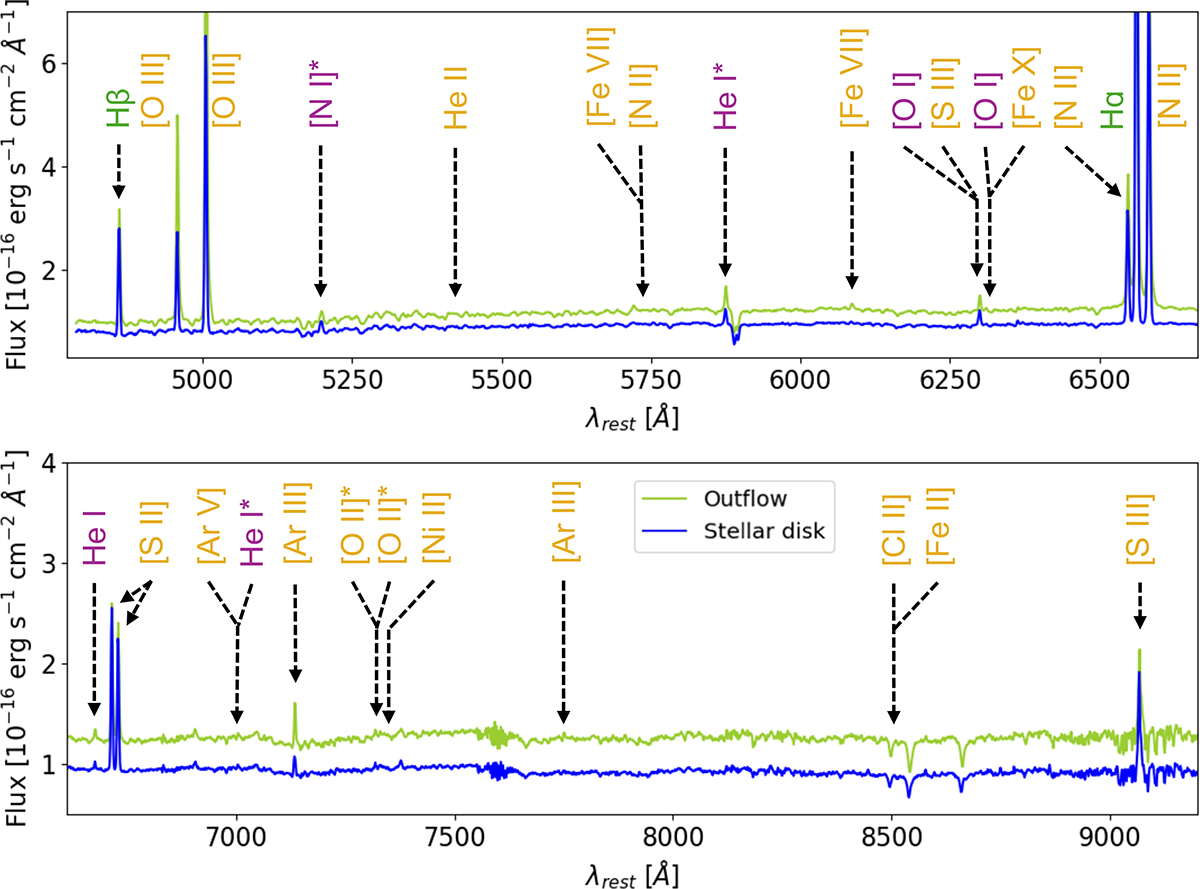
Integrated spectra of NGC 1365 from MUSE data. The blue and green curves represent the integrated spectra extracted with a 0.7″radius aperture from regions dominated by the stellar disk and outflow emission, respectively (see Fig. 1, lower right panel). Detected emission lines are marked with vertical lines: ionized gas emission lines in yellow, atomic lines in violet, and H I recombination lines in green. An asterisk indicates species corresponding to blends of two or three emission lines.
Current usage metrics show cumulative count of Article Views (full-text article views including HTML views, PDF and ePub downloads, according to the available data) and Abstracts Views on Vision4Press platform.
Data correspond to usage on the plateform after 2015. The current usage metrics is available 48-96 hours after online publication and is updated daily on week days.
Initial download of the metrics may take a while.