Fig. C.1
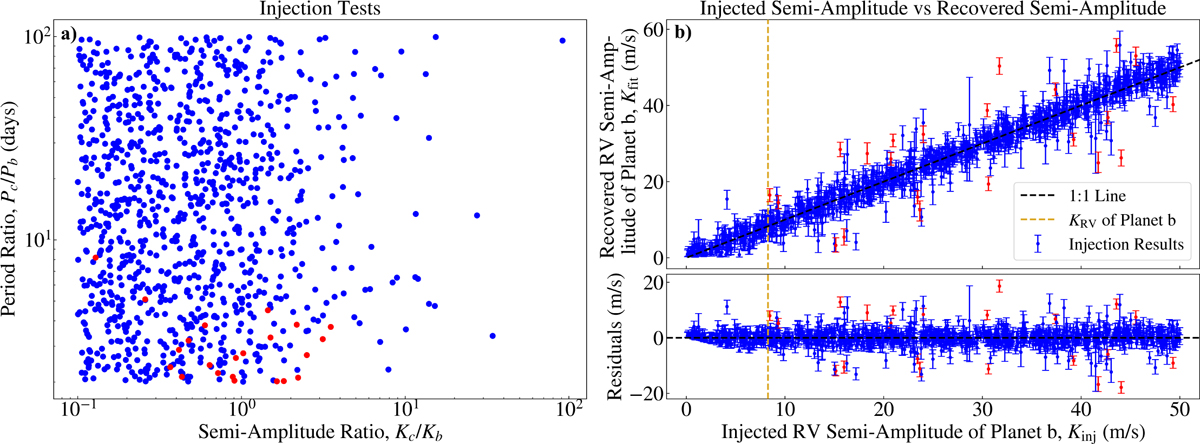
Download original image
Summary of injection and recovery test to test the robustness of the FCO method in the limit of eight NEID observations obtained in three different visits. a) Period ratio between a hypothetical planet c and b as a function of the semi-amplitude ratio of the planets. Blue dots represent runs where the RV amplitude of planet b was successfully recovered (within 3σ of the injected value), while the red dots indicate nonrecovered runs. b) Recovered RV semi-amplitudes Kfit as a function of injected RV semi-amplitudes for planet b (top). Similarly to panel a, blue dots represent recovered runs, whereas red dots indicate nonrecovered runs, and the yellow vertical line indicates our adopted RV semi-amplitude of TOI-2431 b from Table 2. The 1–1 line is indicated with the black dashed line. We see that the recovered values are in good agreement with the injected values.
Current usage metrics show cumulative count of Article Views (full-text article views including HTML views, PDF and ePub downloads, according to the available data) and Abstracts Views on Vision4Press platform.
Data correspond to usage on the plateform after 2015. The current usage metrics is available 48-96 hours after online publication and is updated daily on week days.
Initial download of the metrics may take a while.